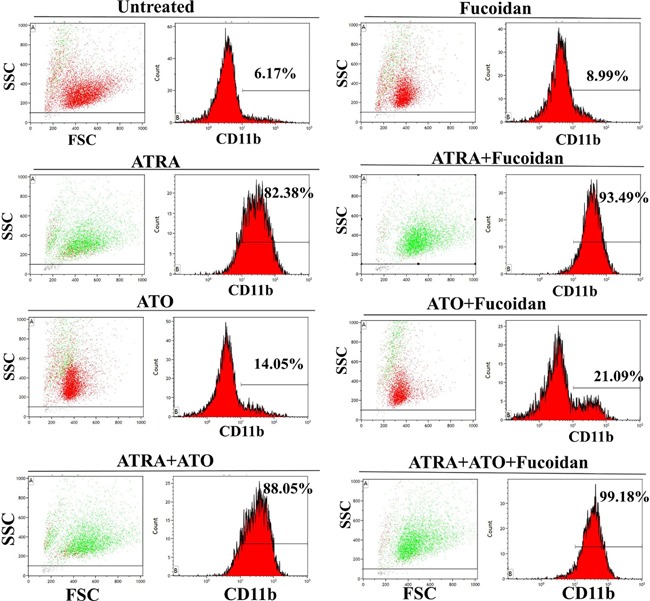
Figure 3. Representative cell differentiation assay.

NB4 cells were treated with low concentration of fucoidan alone (5 μg/ml), low dose of ATRA alone (0.5 μM), low dose of ATO alone (0.5 μM) or in combination and incubated for 5 days. Myeloid differentiation was analyzed by flow cytometry using CD11b expression. Representative percentages display CD11bhigh expressing population indicative of differentiated cells in each treated group. In plot histograms, green population demonstrates differentiated population (CD11bhigh) while red population represents non/low-differentiated cells (CD11bneg/low).
