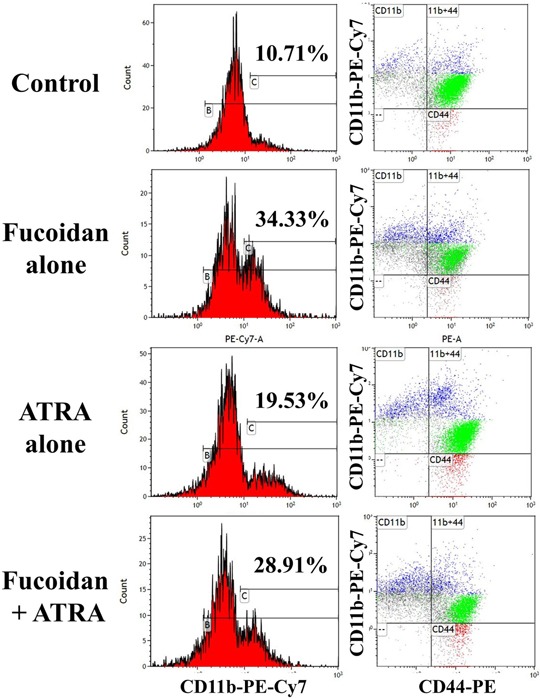
Figure 6. Representative flow cytometry analysis of differentiation in NB4 cells derived from mice tumor mass.

The APL bearing mice were treated with fucoidan, ATRA or their combination and myeloid differentiation in tumor mass was calculated using CD11b expression. The percentage of differentiated cells with CD11bhigh was calculated (left graphs). The right graphs demonstrate the expression of CD11b and CD44. Blue population: differentiated cells (CD11bhighCD44+), green population: non/low differentiated cells (CD11bneg/lowCD44+). Histograms show the flow cytometry results in one representative mouse in each group.
