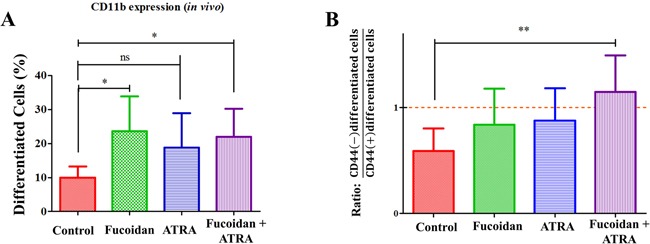
Figure 7.

A. The myeloid differentiation in tumor mass obtained from mice. Differentiation was measured using CD11b expression in tumor mass obtained from mice treated with fucoidan, ATRA and combination compared to control group. Each column represents the mean ± SD values of CD11bhigh cells in each experimental group (n=8/group). Statistical significance was determined by ANOVA, followed by Tukey's multiple comparison test (*: p<0.05). B. The CD44−/CD11b+ Cells to CD44+/CD11b+ Cells ratio in tumor mass obtained from mice. The ratio between CD44− to CD44+ differentiated cells in tumor mass obtained from mice treated with fucoidan, ATRA and combination compared to the control group. Statistical significance was determined by ANOVA, followed by Tukey's multiple comparison test (**: p<0.01). Each column represents the mean ratio of CD44− to CD44+ differentiated cells with error bars the SD.
