
Figure 2. MA-mediated ER stress involved activation of ATF6 pathway.
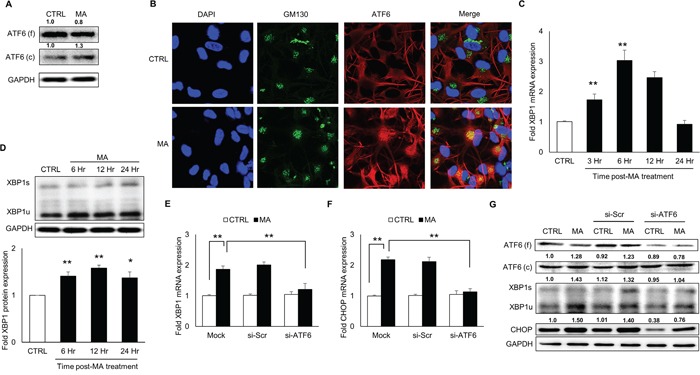
SVGA cells were seeded in 12-well plates at 2.5 × 10⁵ cells/well and treated with 500 μM MA for 12 H unless specified otherwise. For all the experiments involving siRNA transfection, the cells were seeded in 6-well plate and transfected with various siRNA as described in materials and methods prior to treatment with MA. A. The SVGA cells were treated with MA for 12 H and whole cell lysates were prepared. The levels of ATF6 were detected using western blotting using appropriate antibody to detect the cleaved and full form of ATF6. B. Astrocytes were grown on glass coverslips and immunocytochemistry was performed at 6 H after treatment with MA as described in materials and methods. Briefly, the cells were fixed with methanol and stained with appropriate antibodies for ATF6 (red), GM130 (green) and the nuclei were counterstained with DAPI (blue). The cells were also stained with GFAP as astrocyte marker (data not shown). The images were captured using confocal microscope (Leica TCS SP5 II) at 40X zoom. Different channels were merged to obtain co-localization of ATF6 with golgi marker - GM130, to demonstrate activation of ATF6. C. Cells were treated with MA for 3, 6, 12 and 24 H and RNA were isolated. The RNA expressions of XBP1 were measured using real time RT-PCR and fold expressions were calculated with respect to untreated control. D. Similarly, whole cell lysates were prepared at 6, 12 and 24 H and protein levels of XBP1 were measured. E-G. The ATF6 was knocked down using siRNA (as mentioned in materials and methods) and the effect on XBP1 (E) and CHOP (F) RNA were measured using real time RT-PCR. Similarly, the effect of ATF6 knock down was determined on cleaved ATF6, XBP1 and CHOP proteins using western blotting (G). The RNA and protein expressions in all the experiments were normalized with HPRT and GAPDH as housekeeping genes, respectively. The results shown in bar graphs were obtained from at least 3 independent experiments with each treatment performed in triplicates. The bar graphs shown in the figure are represented in mean ± S.E., while the western blots are representative images. The numbers above the blots represent mean intensity of the respective bands. Statistical significance was calculated using one-way ANOVA with multiple comparisons and the values were considered significant if p-value ≤ 0.05 (*) or ≤ 0.01 (**).