
Figure 3. Involvement of IRE1α pathway in MA-mediated ER stress.
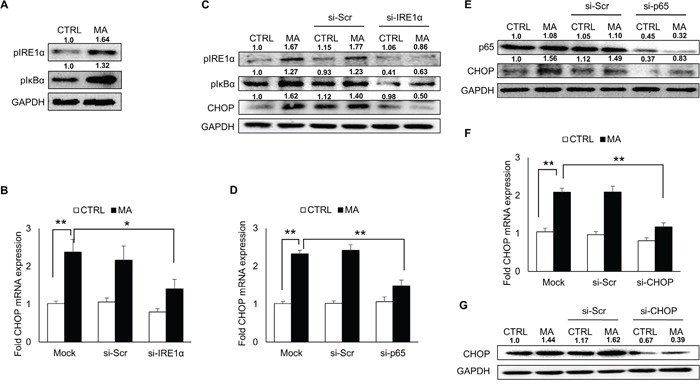
SVGA cells were seeded in 12-well plates at 2.5 × 10⁵ cells/well and treated with 500 μM MA for 12 H. For all the experiments involving siRNA transfection, the cells were seeded in 6-well plate and transfected with various siRNA as described in materials and methods prior to treatment with MA. A. Treatment with MA resulted in increased levels of phosphorylated IRE1α and phosphorylated IκBα indicating their activation. B-G. To confirm their involvement in MA-mediated ER stress, various siRNAs were employed to knockdown their target genes as mentioned in materials and methods. (B-C) The effect of IRE1α knockdown using specific siRNA was determined on MA-mediated CHOP mRNA (B) and protein (C) expressions. (C) Knockdown of IRE1α also reduced the expression of phosphorylated IRE1α and phosphorylated IκBα. (D-E) To confirm the activation of NF-κB, p65 was knocked down using siRNA and the effect on CHOP mRNA (D) and protein (E) expressions. (F-G) The effect of CHOP knockdown was assessed on CHOP mRNA (F) and protein (G) levels. The RNA and protein expressions in all the experiments were normalized with HPRT and GAPDH as housekeeping genes, respectively. The results shown in bar graphs were obtained from at least 3 independent experiments with each treatment performed in triplicates. The bar graphs shown in the figure are represented in mean ± S.E., while the western blots are representative images. The numbers above the blots represent mean intensity of the respective bands. Statistical significance was calculated using one-way ANOVA with multiple comparisons and the values were considered significant if p-value ≤ 0.05 (*) or ≤ 0.01 (**).