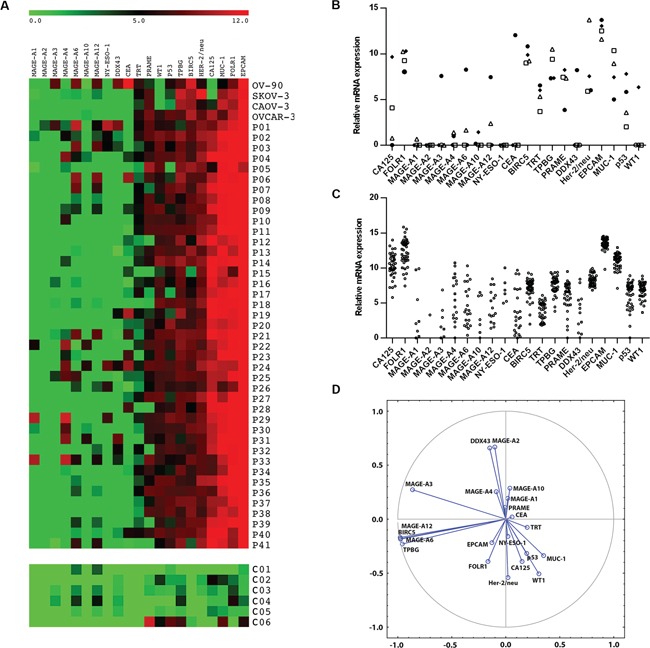
Figure 1. Relative mRNA expression of twenty one TAAs (BIRC-5, CA-125, CEA, DDX-43, EpCAM, FBP, HER-2/neu, MAGE-A1, MAGE-A2, MAGE-A3, MAGE-A4, MAGE-A6, MAGE-A10, MAGE-A12 NY-ESO-1, PRAME, p53, TPBG, TRT, WT-1) in cancer cell lines, primary tumor cells and control ovarian tissue (C01 – C06).

Results were normalized to the expression of reference β-actin. Data are expressed as a heat map A., relative mRNA expression of TAAs in cell lines (B. • OV-90, □ CAOV-3, Δ SKOV-3, ♦ OVCAR-3) and patients C. D. represents visualization of the TAA clusters extracted using Principal Component Analysis.
