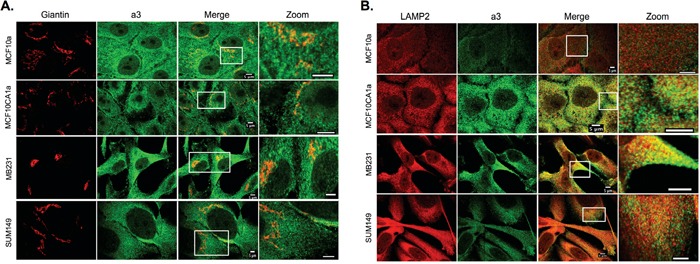
Figure 5. Intracellular localization of subunit a3 and markers for the Golgi apparatus and lysosomes in breast cancer cells.

MCF10a, MCF10CA1a, MB231, and SUM149 cells were grown on poly-d-lysine coated coverslips. To assess whether a3 localizes to the Golgi and lysosomes, cells were fixed, permeabilized, and immunostained using antibodies against subunit a3 of the V-ATPase and Giantin or LAMP2 as markers for the Golgi and lysosomes, respectively. Cells were then incubated with secondary antibodies as described under Materials and Methods. Images were taken with identical exposure times and antibody concentrations. A. Representative images of each of the cell lines stained for the Golgi apparatus marker Giantin (left), subunit a3 (second from left), the merged images (second from right), and the merged image magnified 3.5X (labeled ‘Zoom’, far right). B. Representative images of each of the cell lines stained for the lysosomal marker LAMP2 (left), subunit a3 (second from left), the merged images (second from right), and the inset of the merged image magnified 3.5X (labeled ‘Zoom’, far right). Colocalization is indicated by the presence of yellow pixels. The images in A and B depict representative staining from a minimum of two separate experiments, with an average of 50 cells imaged per experiment for each condition tested.
