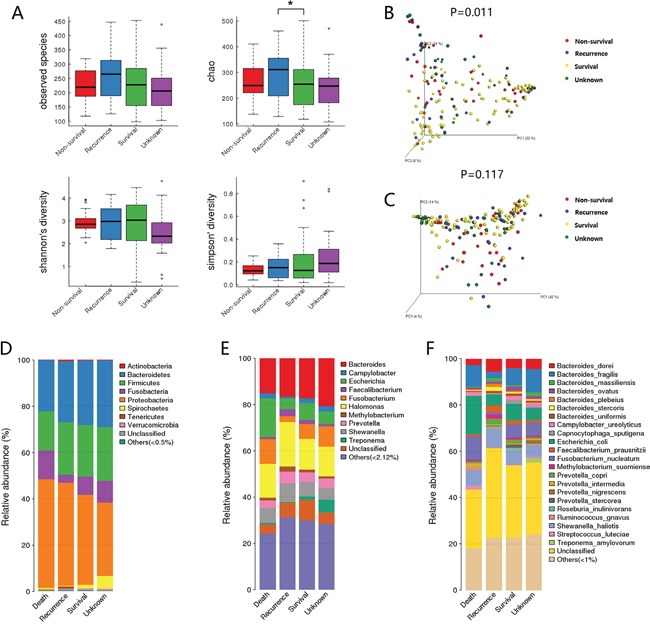
Figure 1. Diversity and structural changes of the tumor microbiota among the Non-survival group (n = 28), Recurrent group (n = 31), Survival group (n = 92) and Unknown group (n = 29).

A. Alpha-diversity distances calculated using phylotype relative abundance measurements among groups. *: statistically significant P <0.05. Principal coordinates analysis (PCoA) scores plot of Bray-Curtis distance matrix B. and weighted Unifrac distance matrix C. based on the relative abundance of OTUs (97% similarity level). Each symbol represents a sample. Colors represent different groups. D. The dominant phyla of different groups. E. The dominant genera of different groups. F. The dominant species of different groups.
