
Figure 3.
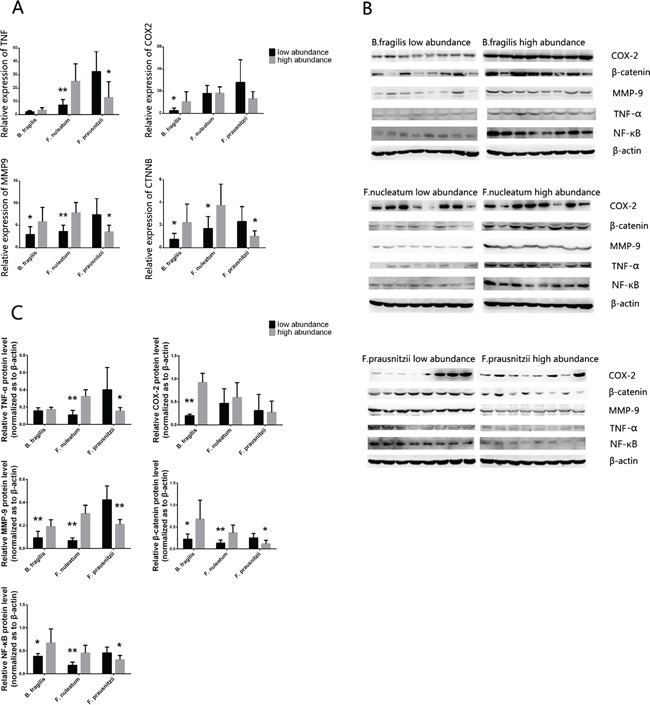
A. The mRNA expression level of the TNF, COX2, MMP9 and CTNNB in cancer tissues with different abundance of B. fragilis, F. nucleatum and F.prausnizii were analyzed by RT-PCR, and the protein of TNF-α, COX-2, MMP-9, β-catenin and NF-κB were analyzed by western blot B. (n = 8 samples per group). Quantitation of the signals C. were analyzed based on the result of western blot. B-actin was used as the endogenous control. P values were calculated with Student's t test. *: statistically significant P<0.05, **: statistically significant P<0.01.