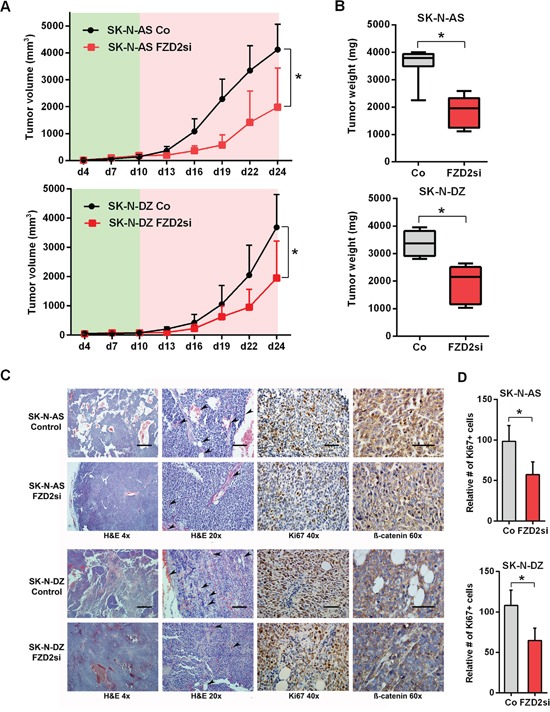
Figure 4. FZD-2 knockdown reduces growth of SK-N-AS and SK-N-DZ xenografts.

A. Tumor volume curves in SK-N-AS and SK-N-DZ tumor xenograft bearing mice treated with FZD2 siRNA (FZD2si) or scrambled siRNA as control (Co). NB cells were injected s.c. into athymic nude mice and tumor growth was monitored in the presence (red shade) or absence (green shade) of siRNA against FZD2 or scrambled siRNA (n = 8 per group). Data are mean ± SD. *, significantly different from control tumors (P < 0.05). B. Quantification of tumor weight of SK-N-AS and SK-N-DZ NB xenografts on day 24 from mice treated with scrambled siRNA or FZD2 siRNA (n = 8 per group). Box and whisker plots show the mean, quartiles and tenth and ninetieth percentiles of the data. FZD2 blockade significantly suppressed tumor weight of NB xenografts in mice. Data are mean ± SD. *, significantly different from control tumors (P < 0.05). C. Histology and immunohistochemical analysis of NB xenografts. Representative images of tumor tissue sections from mice treated with FZD2 siRNA or scrambled siRNA on day 24. Left two columns: H&E staining of NBs. SK-N-AS and SK-N-DZ NB xenografts exposed to FZD2 siRNA indicated morphological changes. The scale bar in the left column (4x objective) represents 500 μm and the scale bar in the middle column (20x objective) represents 100 μm. Arrowheads indicate vessels. Third column: NB xenografts stained with the proliferation marker Ki67. The scale bar in the third column (40x objective) represents 50 μm. Right column: NB tumors stained with total β-catenin. β-catenin expression was higher in SK-N-AS tumors. In both, SK-N-AS and SK-N-DZ xenografts, β-catenin staining intensity was reduced in the FZD2 siRNA group. The scale bar in the right column (60x objective) represents 50 μm. D. Quantitative histomorphometric analysis of Ki67-positive, proliferating tumor cells. Cellular proliferation was significantly reduced following FZD2 blockade. Data are mean ± SD (n = 8 per group). Asterisks (*) indicate P < 0.05 vs. controls.
