
Figure 2. PyMT mice deficient in MYO1E exhibit increased tumor latency but faster increase in volume compared to the MYO1E WT PyMT controls.
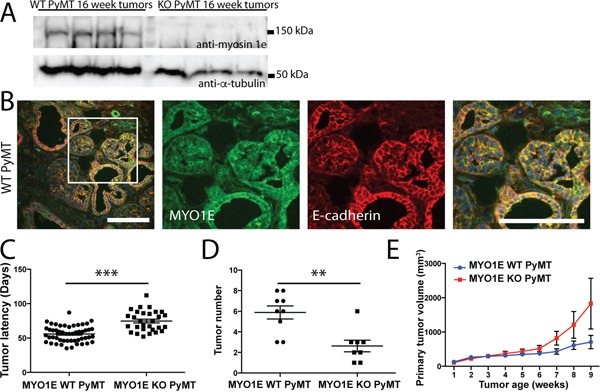
A. Western blot of MYO1E in tumors from 16 week old mice. B. immunofluorescent staining for MYO1E in MYO1E WT tumors. DAPI staining is shown in blue. Scale bar, 100 um. C. tumor latency (in days) in MYO1E WT and KO PyMT mice; error bars indicate SEM. Latency of KO PyMT tumors was substantially increased compared to controls, averaging 74.7 days compared to 55.7 days for WT PyMT tumors (p<0.001). D. tumor number in 10 week old animals, error bars indicate SEM. KO PyMT tumor number was significantly decreased, with an average of 2.6 tumors/mouse compared to 5.9 tumors/mouse in WT PyMT mice (p<0.01). E. primary tumor volume relative to tumor age (time in weeks from tumor detection). KO tumors grew faster than WT tumors, although the difference was not statistically significant. WT PyMT mice had an average volume of 705 mm3 at 9 weeks of tumor age, compared to 1828 mm3 in KO PyMT mice. The error bars represent SEM.