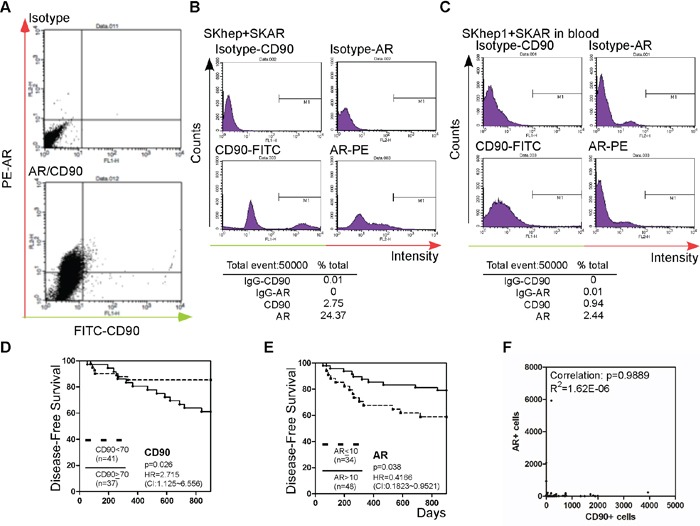
Figure 2. Detection of CTC AR, and CTC CD90+ in patient blood.

A. SKhep1 and SKAR cells were co-stained with CD90 and AR antibodies. Green (x-axis) represents the cells stained with CD90 and IgG-FITC-conjugated secondary antibody, and red (y-axis) represents the cells stained with AR and IgG-PE-conjugated secondary antibody. The upper panel shows isotype (FITC- or PE-conjugated) secondary antibody staining only as the background control. B. SKhep1 and SKAR cells were mixed in a 1:1 ratio and then co-stained with CD and AR antibodies. The CD90+ cells represented 2.75% and AR+ cells represented 24.37% of the cell populations. C. A SKhep1/SKAR cell mixture (total 105 cells) was added to 10 ml of whole blood, and the PBMCs were then separated. Approximately 20% (v/v) of the PBMCs were co-stained with CD90 and AR antibodies. The CD90+ cells represented 0.94% and AR+ cells represented 2.44% of the PBMC population. D, E. The association between HCC disease-free survival (DFS) after hepatectomy and CD90 (D) or AR (E) expression. Patients with a higher number of circulating CD90+ cells (≥70 cells) (n = 37) exhibited poorer DFS than patients with a lower number of circulating CD90+ cells (< 70 cells) (n = 41), whereas patients with a higher number of circulating tumor cells expressing AR (> 10 cells) (n = 48) exhibited better DFS than patients with a lower number of circulating AR+ tumor cells (≤10 cells) (n = 34). F. The correlation between AR+ and CD90+ cells was analyzed. The P-value was 0.9889 (R2 = 1.62E-06).
