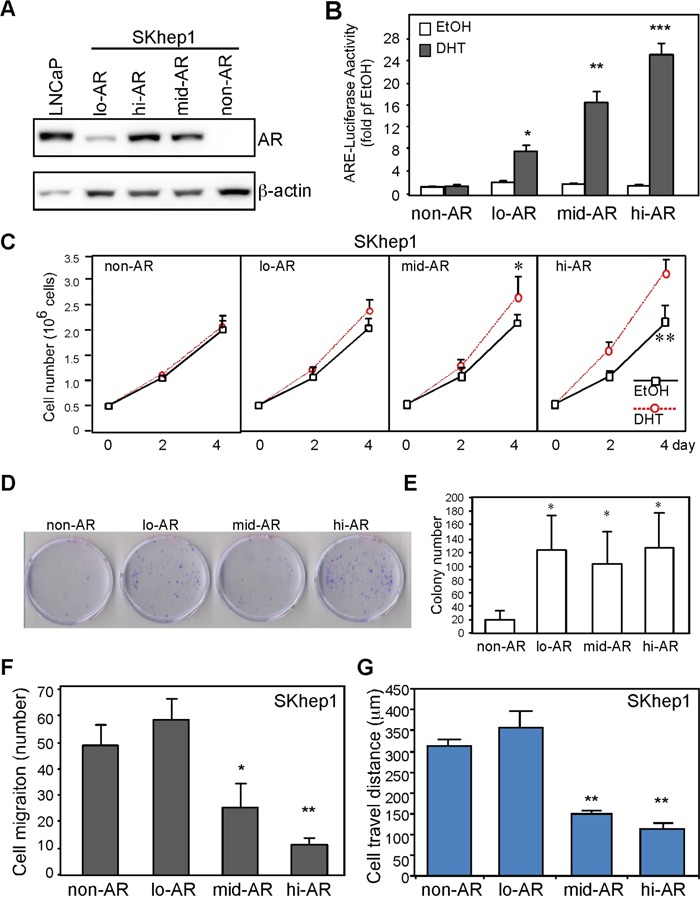
Figure 4. AR expression promotes growth and suppresses HCC cell migration.

A. Establishment of stable clones with differential AR expression. LNCaP: prostate cancer cells expressing AR served as a positive control; lo-AR: SKhep1 cells endogenously expressing low levels of AR; mid-AR: SKhep1 cells engineered to express a moderate level of AR; hi-AR: SKhep1 cells engineered to express high levels of AR. B. SKhep1 cells differentially expressing AR were transfected with ARE-luciferase and pRL-TK (transfection control) plasmids to detect AR transactivation. Cells were treated with either ethanol (EtOH) or 10 nM DHT for 24 h before measuring the dual-luciferase activity. All readings were compared with EtOH-treated non-AR cells. C. AR promotes short-term cell growth. The non-AR, lo-AR, mid-AR (p=0.039), and hi-AR (p=0.006) cells were seeded (5 × 10⁵ cells/dish) and cultured for 4 days. Cell numbers were counted and plotted. D, E. AR promotes long-term cell growth. The non-AR, lo-AR, mid-AR, and hi-AR cells were seeded (103 cells/dish), cultured for 14 days, and then stained with trypan blue. “D” is the representative image to demonstrate AR effect on colony size. “E” is the statistic result of colony number. F, G. AR suppressed cell migration (F; Boyden chamber transwell cell migration assay) and travel distance (G; real-time cell mobility assays) in an expression-dependent manner. Compared to non-AR cells, cell migration number and travel distance were comparable in lo-AR cells but were markedly lower in mid-AR and hi-AR cells. The plotted data were from the mean value of at least three independent experiments, and SD was used to show the variation in the experiments.
