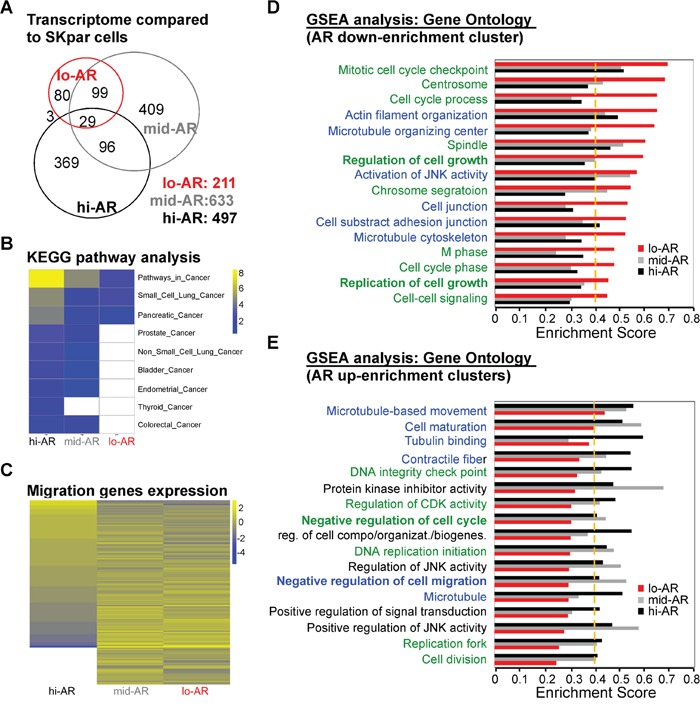
Figure 5. Systems biological analysis revealed that AR-mediated reprogramming of the transcriptome suppressed the expression of migration-related gene clusters.

A. We used cDNA microarray analysis to compare the number of genes expressed in lo- (211 genes), mid- (633 genes), and hi-AR (497 genes) cells with that in non-AR cells. The numbers of overlapping genes were: lo-AR vs. mid-AR = 128 genes; mid-AR vs. hi-AR = 125 genes; lo-AR vs. hi-AR = 32 genes. The number of overlapping genes in all three cell types was 29. B. KEGG pathway analysis of microarray data in lo-AR, mid-AR, and hi-AR cells revealed a positive correlation between AR expression and the expression of cancer-related genes. C. The Gene Ontology analysis of the migration-related genes in lo-AR, mid-AR, and hi-AR cells revealed an AR-dependent ascending or descending pattern of gene expression. D, E. Gene set enrichment analysis (GSEA) was used to study the effect of AR on gene expression. The green-colored label represents the gene clusters associated with cell cycle, while the blue-colored label represents cell mobility–associated clusters. The ratio of cell cycle to migration-related genes was 10:6 in the AR down-enrichment clusters and 6:7 in the AR up-enrichment clusters. A change of > 0.1 in the Enrichment Score (ES) and an ES threshold > 0.4 were considered as significant changes in the gene clusters. UP: upregulation; DN: downregulation; KD: knockdown; KO: knockout.
