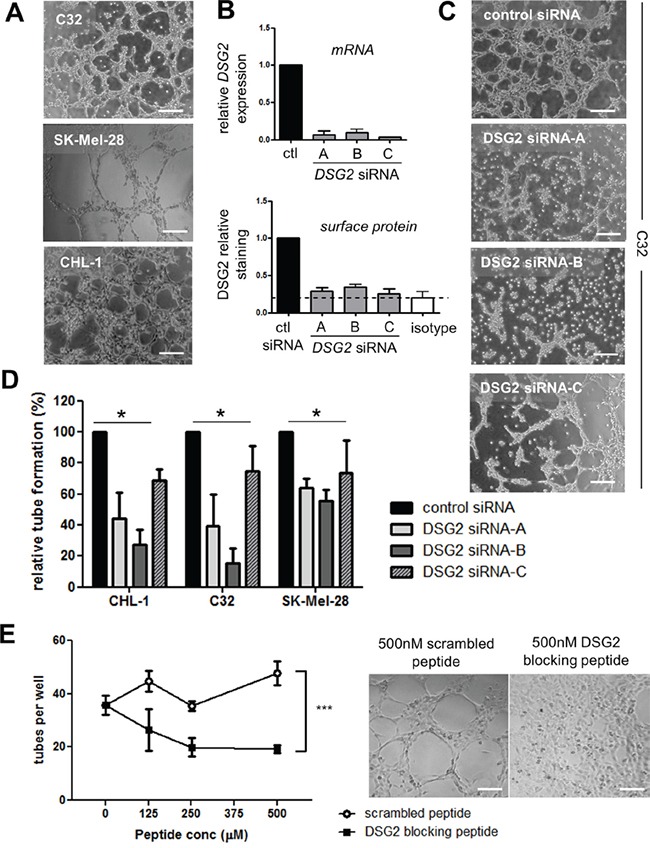
Figure 4. DSG2 regulates the formation of tube-like structures by melanoma cells on Matrigel.

A. Photomicrographs illustrate tube formation by three DSG2+ cell lines (C32, SK-Mel-28 and CHL-1) 4-6 hr after seeding on Matrigel. B. Validation of gene knockdown following treatment of the C32 cell line with DSG2-targeting or control siRNAs. The level of DSG2 mRNA was quantified after 48 hr by qPCR (top), or DSG2 surface protein was quantified after 72 hr by flow cytometry (bottom). Graphs show mean ± SEM (normalized to control siRNA), pooled from 2 – 4 experiments. C. An example of the effect of DSG2 knockdown on tube formation by C32 melanoma cells after 6 hr. D. The number of tubes formed per well was quantified for three melanoma cell lines. Data show mean ± SEM (normalized to control siRNA) pooled from 3-4 experiments; * p < 0.05 by ANOVA. E. DSG2 blocking peptide was added to CHL-1 cells prior to seeding on Matrigel, and tube formation after 3.5 hr was quantified as above. Graph on the left shows tube counts per well (mean +/− SEM, pooled from 4 experiments; *** = p < 0.001 by ANOVA). Images on the right show representative results at 500μM peptide. Scale bars = 200μm.
