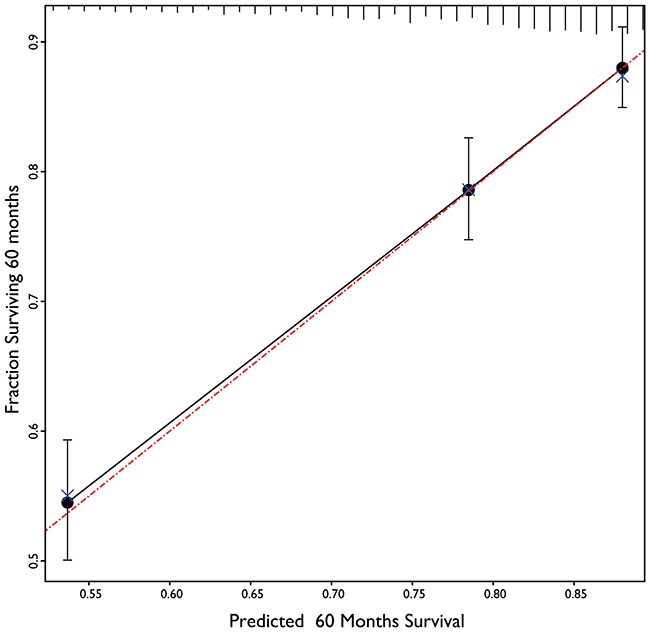
Figure 2. Calibration plot of 5 years overall survival prediction model.

The calculated values of three prognostic groups (black circles) lie very close to the reference line of perfect calibration (red dash-dot line). The blue X shows the small movements in calibration achieved by bootstrapping procedure to decrease the overfitting of the model.
