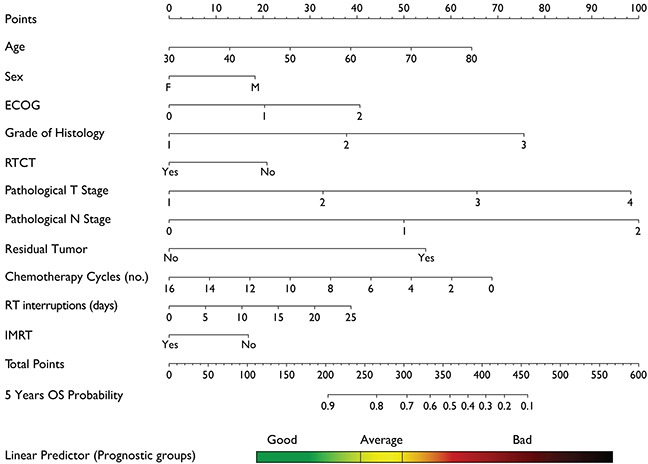
Figure 4. Nomogram for calculation of 5 years Overall Survival.

Each value in the covariates corresponds to a given score that can be obtained in the top line of the nomogram (“Points”). After summing all the scores for each covariate value the final sum has to be identified in the line “Total Points”. Tracing a vertical line from “Total Points” line down to “5 Years OS Probability” line you can read the expected survival probability assigning the patients to one of the three prognostic groups used for model calibration.
