
Figure 3. Autophagy inhibition reduces cell growth and induces apoptosis in cHL cells.
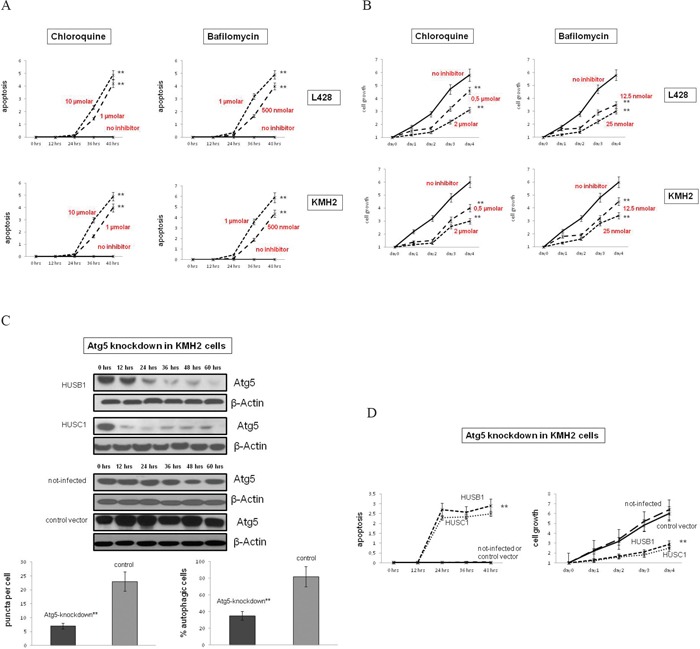
A. The cHL cell lines L428 and KMH2 were pre-incubated with the autophagy inhibitors CQ or Baf in two different concentrations of each. Apoptosis was determined by quantification of cytosolic nucleosomes over 48 hrs of incubation (ELISA). Difference in mean absorbance at A405 and A450 was measured. Results are expressed as means±SD for n=3 experiments for each cell line and each condition tested. ** Cell lines significantly different vs. control group (treated vs. untreated cells) by the t-test (p<0.001). B. Cell growth of cHL cell lines treated with CQ or Baf, as compared to untreated cells was determined by trypan blue exclusion method. Results are expressed as means±SD for n=3 experiments for each cell line and each condition tested. ** Cell lines significantly different vs. control group (treated vs. untreated cells) by the t-test (p<0.001). C. To inactivate autophagy genetically KMH2 cells were infected with two different lentiviral vectors encoding two different shRNAs (HUSB1, HUSC1) that inhibit ATG5-RNA expression. Upper panel, ATG5 expression in these cells and in control cells (infected with empty vectors or not infected) was determined by Western Blot analysis. β-Actin was used as a loading control. Shown is one representative Blot of n=3 experiments. Lower panel, To analyze the status-quo of autophagy knockdown cells and control cells were stained to LC3II and % autophagic cells was determined by confocal microscopy analysis. Results are expressed as means±SD for n=4 experiments. ** Cell lines significantly different vs. control group (knockdown vs. control cells (infected with empty vector or not-infected)) by the t-test (p<0.001). D. Apoptosis/cell growth of ATG5-knockdown and control KMH2 cells was analyzed by trypan blue exclusion method. ** Cell lines significantly different vs. control group (knockdown vs. control cells (infected with empty vector or not-infected)) by the t-test (p<0.01).