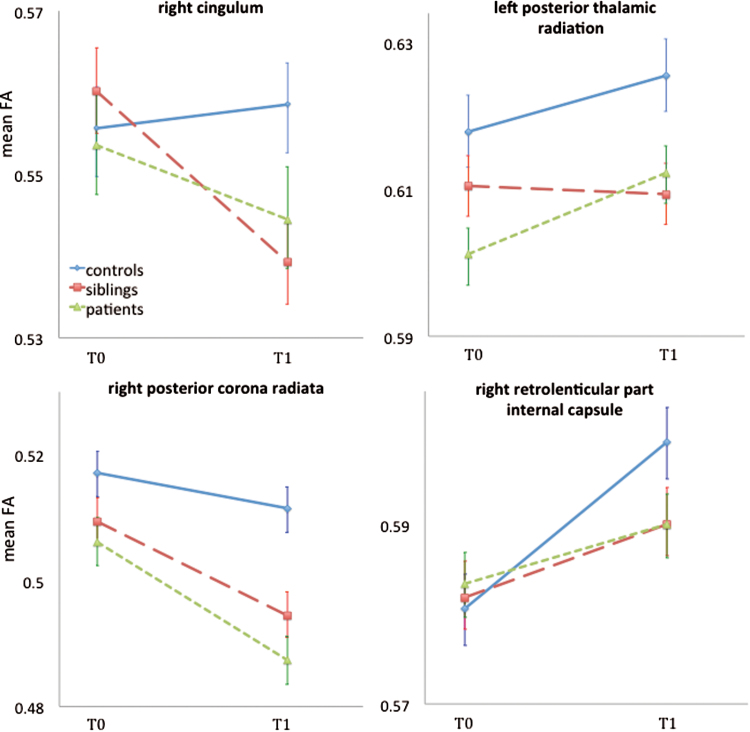
Fig. 2.
Group × region interactions in the model of ΔFA. Group differences in mean ΔFA in 4 WM tracts are displayed (P Simes < .02), corresponding with table 3. Error bars represent the SE of the mean ΔFA at baseline and at follow-up. FA, fractional anisotropy.

