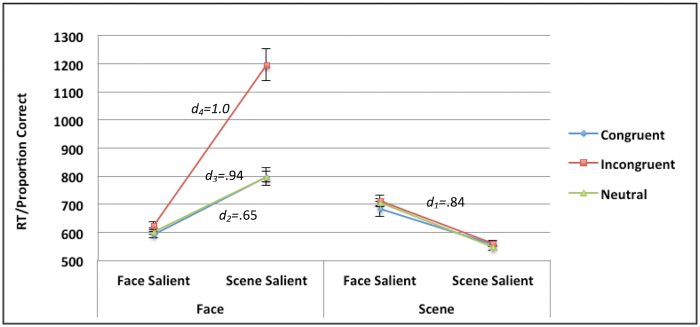
Fig. 5.
Overall performance on the face-scene perception task as a function of target (face vs scene), saliency (face salient vs scene salient), and congruency (congruent vs incongruent vs. neutral). Effect sizes (Cohen’s d) represent the magnitude of the cost associated with the shift from target salient to distractor salient (all ps < .001). d1 represents the effect size of overall saliency cost in the scene condition (no effect for congruency). In the face condition, d2 and d3 represent the effect sizes of saliency cost in the congruent and neutral conditions, respectively. The effect size of saliency cost in the incongruent condition is represented by d4. Bars represent standard errors of the mean.

