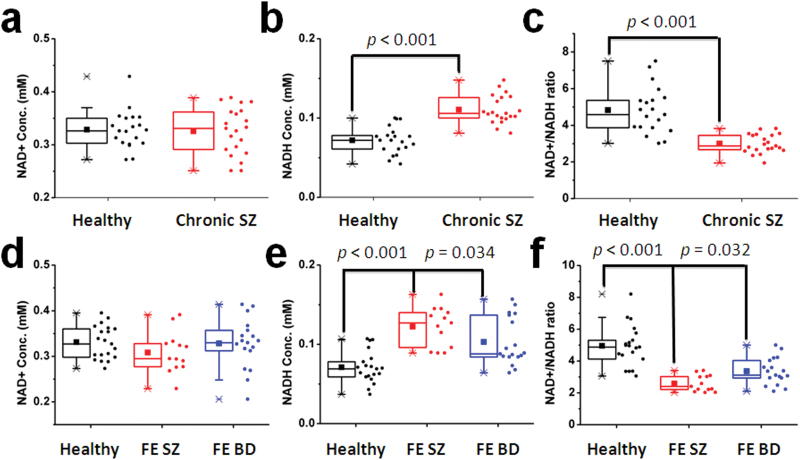
Fig. 2.
Box and whisker plot showing NAD+ (a and d), NADH (b and e), and RR (c and f) in the control and chronic schizophrenia (SZ) groups as well as in FE SZ, FE BD patients, and their age-matched control group. Individual data are also shown to the right of box plots. Bottom and top boundaries of each box indicate 25th and 75th percentiles, lower and upper whiskers indicate first and 99th percentiles. A horizontal line and filled square inside each box indicate median and mean values, respectively.

