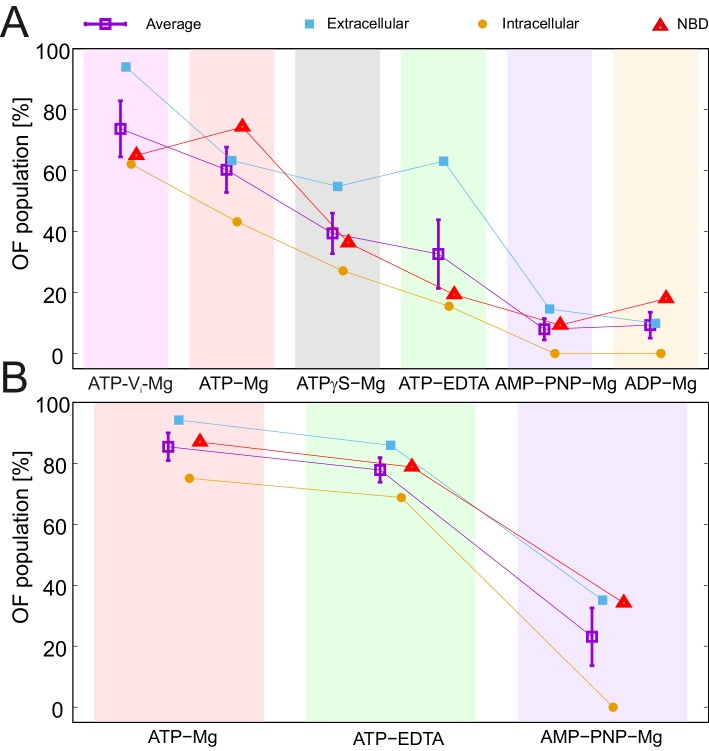
Figure 5. Nucleotide ranking according to the ability to populate the OF conformation.
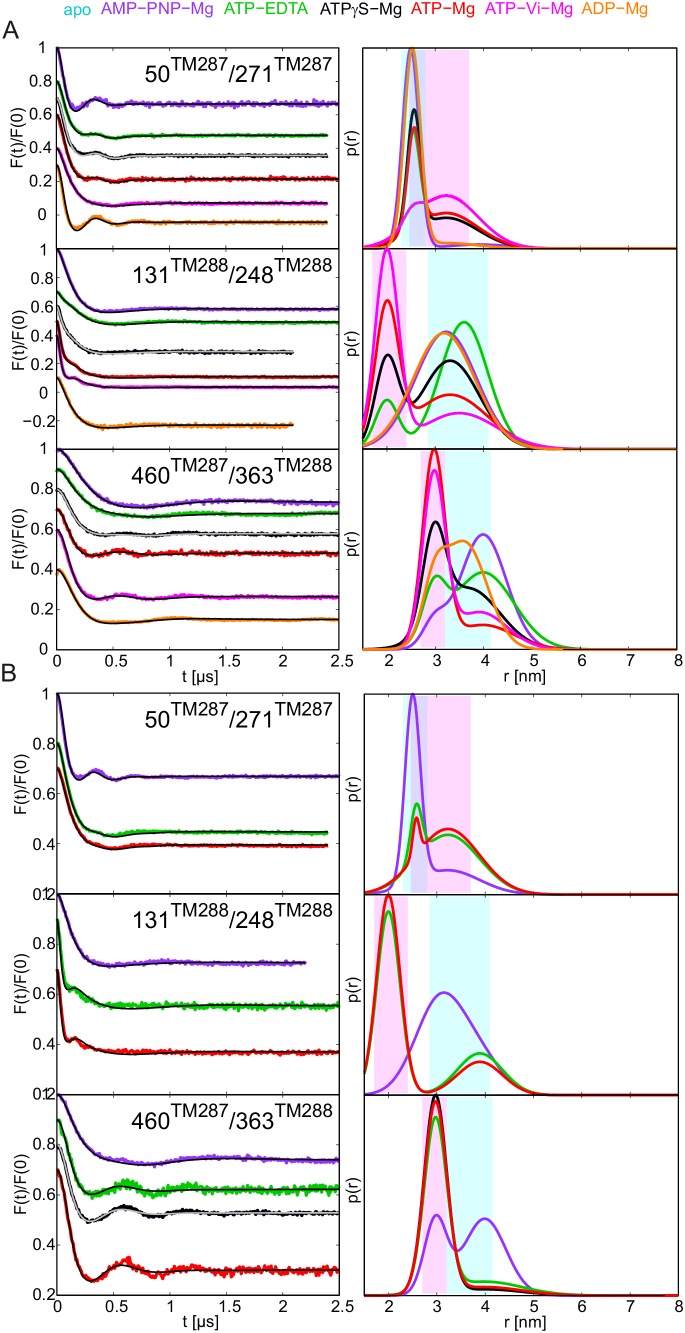
Three spin-labeled pairs of TM287/288 representing the extracellular region (150TM287/295TM288), intracellular region (131TM288/248TM288) and the NBDs (460TM287/363TM288) were used for the analysis of the IF/OF populations in the wildtype transporter (A) and the E-to-Q mutant (B). The percentage of the OF population was calculated using the relative area under the model-based two Gaussian distance distribution performed using DeerAnalysis2015. The purple squares with error bars show the average ability of each nucleotide to stabilize the conformational switch. Background-corrected DEER traces and corresponding distance distributions are shown in Figure 5—figure supplement 1.
DOI: http://dx.doi.org/10.7554/eLife.20236.016


