. 2017 Jan 4;6:e20236. doi: 10.7554/eLife.20236

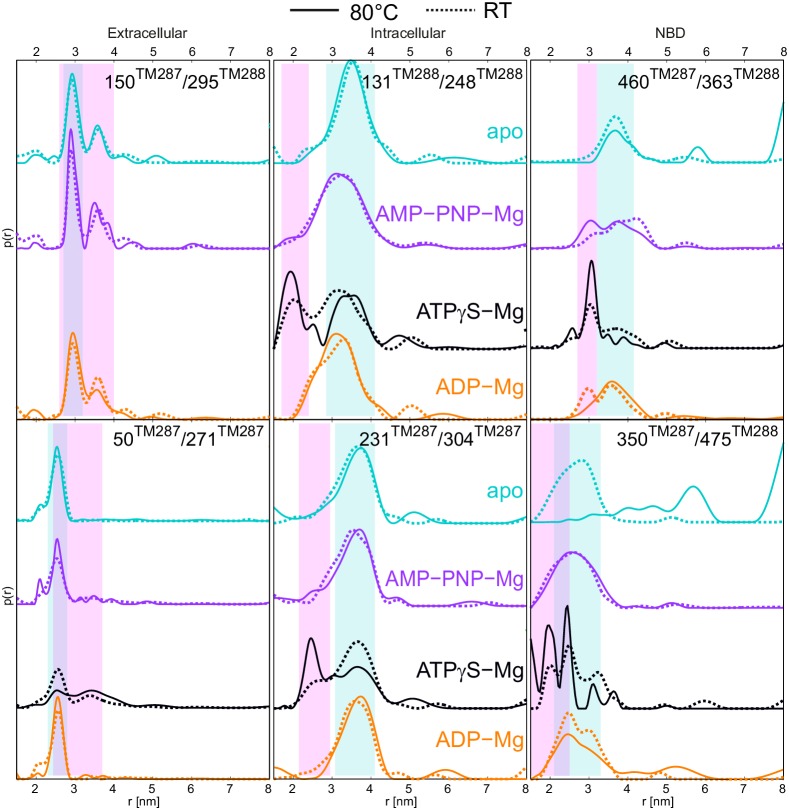
Figure 6. DEER distance distribution of samples snap frozen from room temperature and 80°C.

Q-band DEER distance distribution for the six spin-labeled pairs engineered on wildtype TM287/288. Distance distributions normalized by area are shown for the samples incubated at room temperature snap frozen in liquid nitrogen (dashed lines, taken from Figure 2 and Figure 2—figure supplement 3) and samples incubated at 80°C and snap frozen in cold isopentane (solid lines). The corresponding DEER data and analysis are shown in Figure 6—figure supplement 1.

DOI: http://dx.doi.org/10.7554/eLife.20236.019

Figure 6.

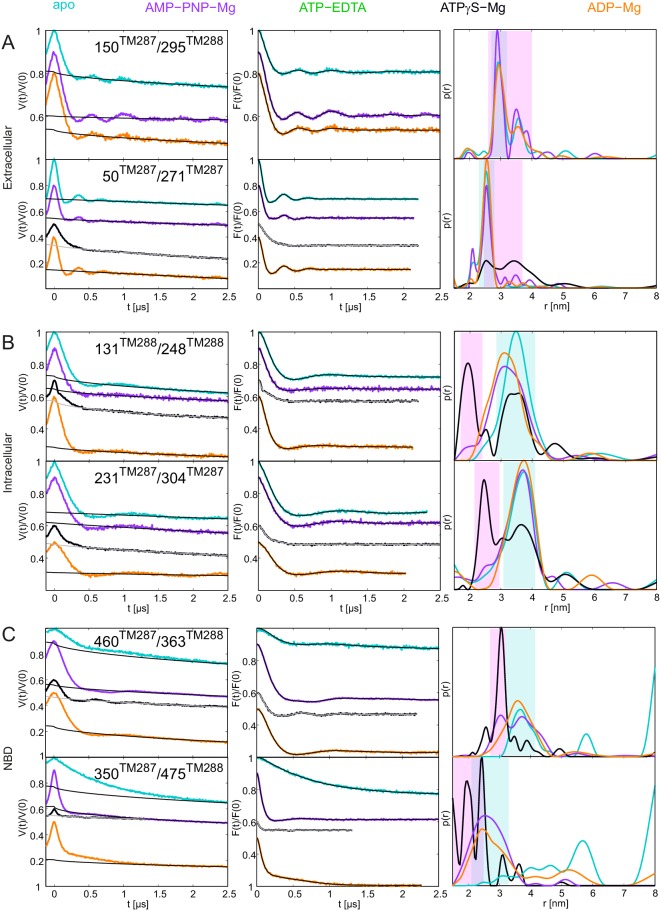
Figure 6—figure supplement 1. DEER analysis of wildtype TM287/288 snap frozen from 80°C.

Figure 6—figure supplement 1.

Q-band DEER traces [V(t)/V(0)], background corrected DEER traces [F(t)/F(0)] with fitted distribution function and corresponding distance distributions (from Figure 6) for the six spin-labeled pairs engineered on wildtype TM287/288 incubated at 80°C and snap frozen in isopentane. (A) Extracellular pairs 150TM287/295TM288 and 50TM287/271TM287. (B) Intracellular pairs 131TM288/248TM288 and 231TM287/304TM287. (C) NBD pair 460TM287/363TM288 monitoring the consensus site and 350TM287/475TM288 monitoring the degenerate site.