. 2017 Jan 4;6:e20236. doi: 10.7554/eLife.20236

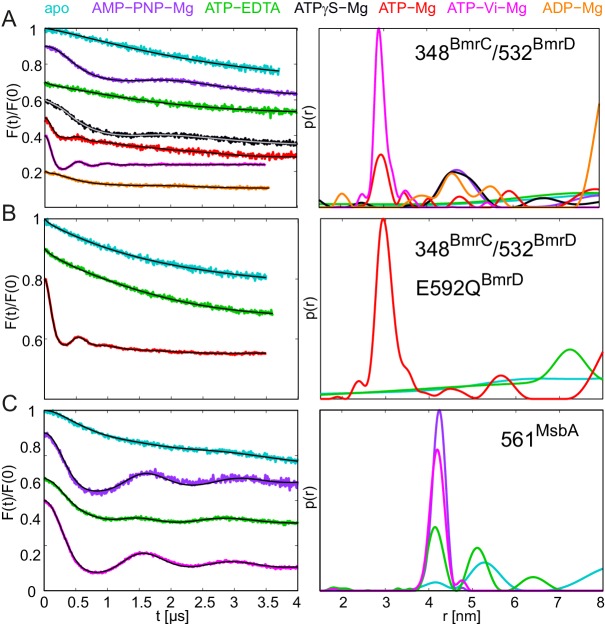
Figure 9. DEER analysis of spin-labeled pairs in the NBDs of BmrCD and MsbA.

Q-band background-corrected DEER traces [F(t)/F(0)] with fitted distribution function (left) and corresponding distance distribution (right). (A) Spin labeled pair 348BmrC/532BmrD in wildtype BmrCD and (B) in BmrCD carrying the E-to-Q substitution incubated with different nucleotides and nucleotide analogs. (C) Spin labeled 561MsbA in wildtype MsbA incubated with different nucleotides and nucleotide analogs. Primary DEER traces are shown in Figure 9—figure supplement 1. DEER traces detected for BmrCD after incubation with 10 mM nucleotides are shown in Figure 9—figure supplement 2.

DOI: http://dx.doi.org/10.7554/eLife.20236.023

Figure 9.

Figure 9—figure supplement 1. DEER analysis of BmrCD and MsbA.

Figure 9—figure supplement 1.

Q-band primary DEER traces [V(t)/V(0)] with fitted background for the spin-labeled pair 348BmrC/532BmrD in (A) wildtype BmrCD and (B) in BmrCD containing the E-to-Q mutation; (C) data for the spin-labeled pair 561MsbA in wildtype MsbA. Color coding as in Figure 9.
Figure 9—figure supplement 2. DEER analysis of wildtype BmrCD in the presence of 2.5 and 10 mM ATP.

Figure 9—figure supplement 2.

Q-band DEER trace [V(t)/V(0)] with the background fit (left), background corrected DEER trace [F(t)/F(0)] with fitted distribution function (center) and the corresponding distance distribution normalized to the area (right) for the spin-labeled pair 348BmrC/532BmrD in wildtype BmrCD. The light and dark green traces are obtained with EDTA 2.5 mM and 2.5 mM or 10 mM ATP, respectively. The light and dark red traces were detected in the presence of 2.5 mM or 10 mM ATP-Mg, respectively.