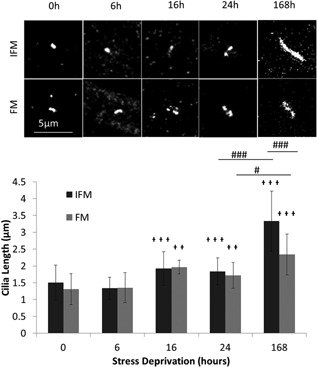
Figure 3.

Stress deprivation time course shows that initially cilia length increases at the same rate in FM and IFM cells but after 1 week IFM cell cilia are considerably longer than FM cell cilia. (a) Shows representative cilia in the IFM & FM for each time point. (b) Shows mean cilia length in fascicular and IFM cells after 0, 6, 16, 24, and 168 h of stress deprivation. N > 40 cilia measured per condition. Crosses ( ) show significance from the same region in 0 h tissue. Hashes (#) show significance between the two tendon regions for a given condition. *,
 ,#
p < 0.05, **,

 ,##
p < 0.01, ***,


 ,###
p < 0.001. Error bars show ±1 standard deviation.
