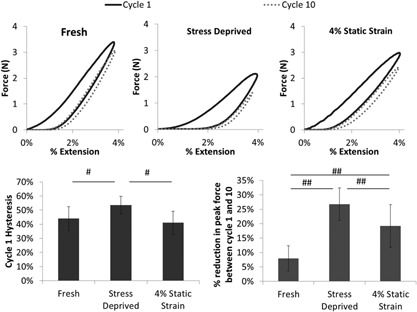
Figure 4.

Under stress deprivation there is significant increase in viscoelastic behavior. (a–c) Show representative 4% cyclic preconditioning loops for fresh, stress deprived, and 4% static strained fascicles, respectively. Each figure shows preconditioning cycles 1, 2, and 10. (d) Shows the mean hysteresis in the first preconditioning cycle. (e) Shows the mean percentage reduction in peak force over the 10 preconditioning cycles. N = 8 fascicles per group. # p < 0.05, ## p < 0.01, ### p < 0.001. Error bars show ±1 standard deviation.
