Figure 3.

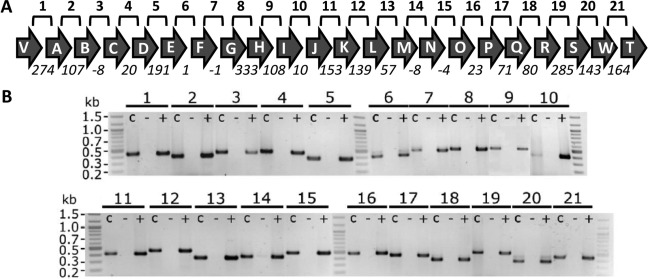
The andrimid gene cluster is organized as a polycistronic transcriptional unit.
A. Schematic representation of the adm gene cluster in Serratia plymuthica A153. Lines labelled 1‐21 above the gene cluster represent the regions amplified by RT‐PCR and shown in B. Numbers below the arrows represent the intergenic distance in base pairs, and negative numbers indicate overlapping genes.
B. Transcript analysis by RT‐PCR using primers designed to span the intergenic region between two adjacent genes. For each region, three PCR analyses were carried out: +, RT‐PCR on cDNA; −, negative control with no reverse transcriptase; c, positive control with genomic DNA as template. Culture samples for RNA isolation were taken at early stationary phase (Fig. 4).
