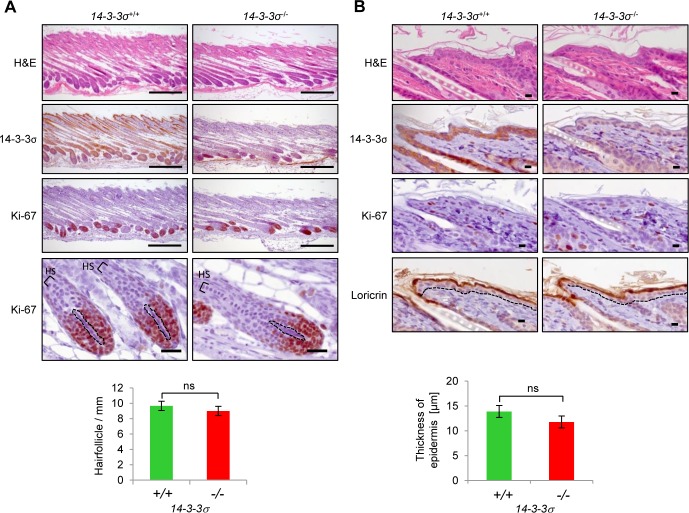
Figure 2. Comparison of back skin morphology in 14-3-3σ+/+ and 14-3-3σ−/− mice.
Back skins from wild-type and 14-3-3σ knock-out mice were resected at postnatal day 17, paraffin embedded, vertically sectioned and stained with haematoxilin/eosin (H&E, upper panels) or subjected to immunohistochemistry with 14-3-3σ, Ki-67, and Loricrin specific antibodies. A. Hair follicle density (scale bar = 300 μm) and hair shaft (HS) morphology (scale bar = 30 μm) are visible. The dashed line indicates the dermal papilla. Bar-chart: The average number of hair follicles per millimeter skin section was evaluated (n = 3). B. A higher magnification of the interfollicular epidermis and the underlying dermis is shown (scale bar = 10 μm). The dashed line indicates the border between epidermis and dermis. The Loricrin staining shows the outermost layer of the epidermis. Bar-chart: The average epidermal thickness was evaluated (n = 3).

