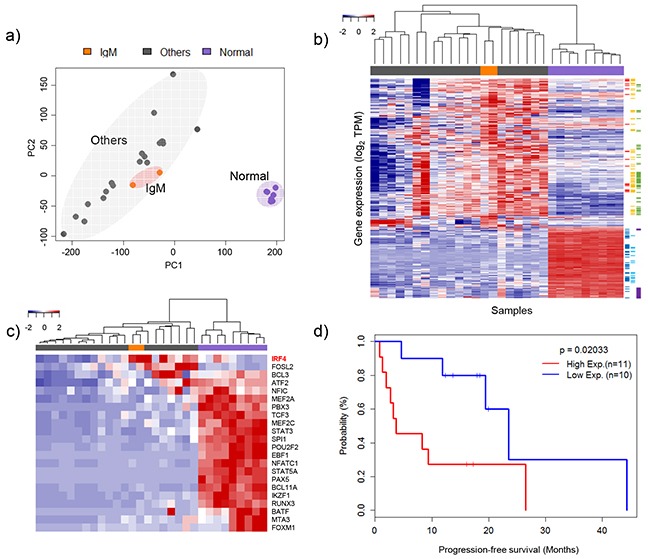
Figure 3. Clustering of gene expression profiles and heat map for specific gene sets.

a. Principle component analysis of gene expression levels. Three distinct groups were plotted in two-dimensional space: IgM types, other types (IgG, IgA, and no heavy chain) and normal samples. b. Clustering of differentially expressed genes. Red, black, and blue groups indicate IgM types, other types and normal samples, respectively. Sidebar is color coded by molecular function using David (https://david.ncifcrf.gov): red = oxidative phosphorylation, yellow = organelle membrane, green = ER related genes, blue = immune response, sky-blue = leukocyte activation and purple = immunoglobulins. c. Heat map of the expression profiles of genes associated with B-cell-specific transcription factors (TFs) [14]. d. Clinical outcomes of multiple myeloma (MM) patients according to IRF4 expression level.
