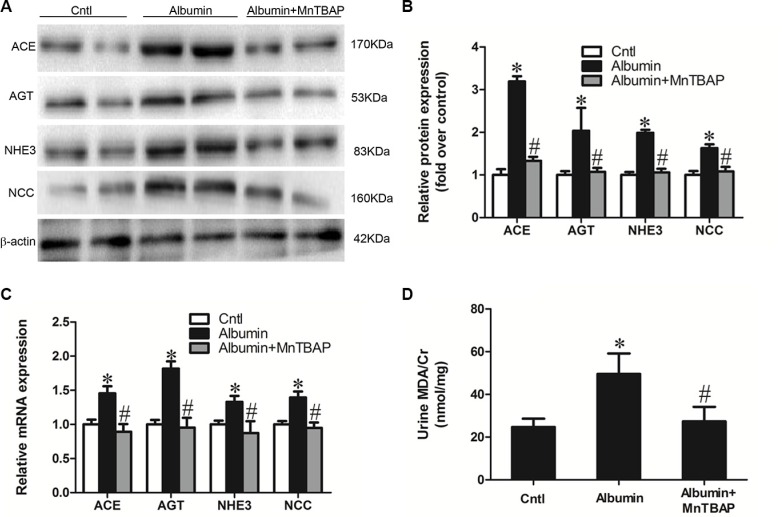
Figure 5. MnTBAP treatment reversed the albuminuria-induced alteration of sodium transporters and their involved signaling pathway.
(A) Western blots of ACE, AGT, NHE3, and NCC illustrates the normalization of protein expression by MnTBAP treatment. (B) Densitometric analyses of ACE, AGT NHE3, and NCC. (C) qRT-PCR analyses of ACE, AGT, NHE3, and NCC confirm the impression that is observed in the western blot. (D) Urinary output of MDA. The values represent the means ± SDs (n = 6 in each group). *p < 0.01 vs. control group. #p < 0.01 vs. albumin-overloaded group.

