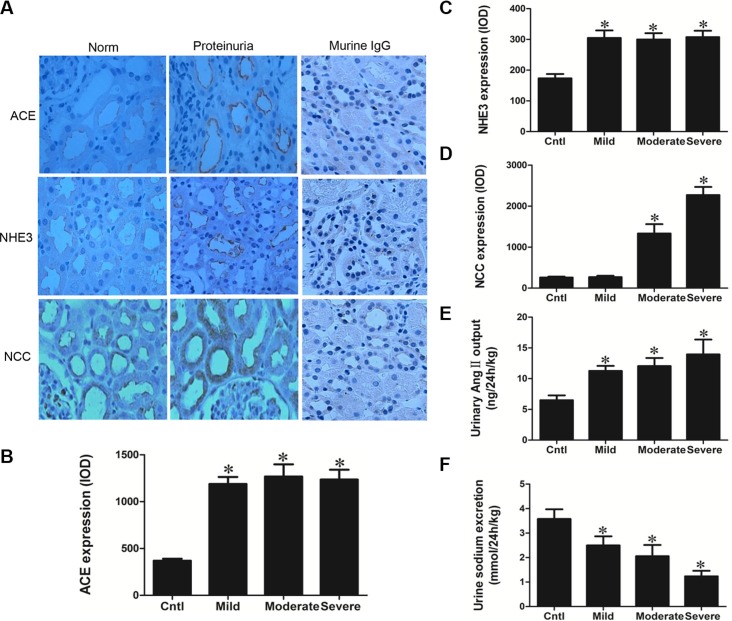
Figure 6. Analyses of ACE, NHE3, NCC, Ang II, and urinary sodium excretion in the proteinuric patients.
(A) Immunohistochemistry of ACE, NHE3, and NCC demonstrate enhanced tubular expression of these elements in proteinuric kidney. (B) Semi-quantitative measurement of ACE immunoreactivity. (C) Semi-quantitative measurement of NHE3 immunoreactivity. (D) Semi-quantitative measurement of NCC immunoreactivity. (E) Urinary Ang II excretion was stimulated in proteinuric patients. (F) Urinary sodium excretion was reduced in proteinuric patients. The values represent the means ± SDs. For urinary Ang II assay, n = 12–33 in each group. In other experiments, n = 6 in each group. *p < 0.01 vs. control group.

