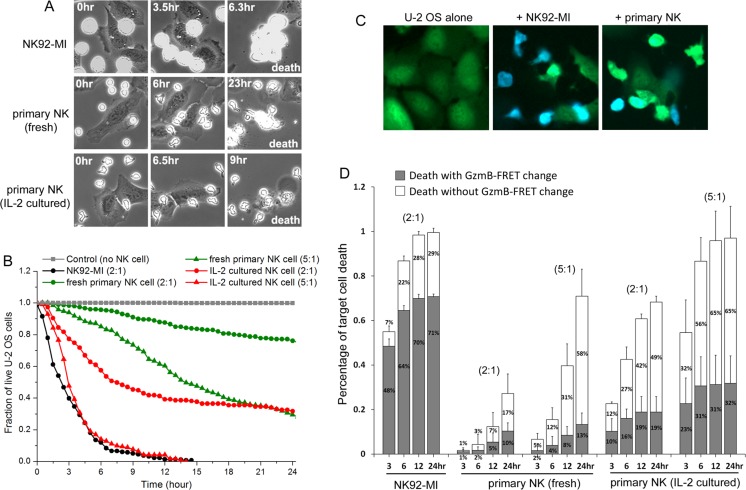
Figure 1. Cytotoxic dynamics of primary NK cells are distinct from NK cell line, NK92-MI.
(A) Phase-contrast images of distinct NK cells in co-culture with a human cancer cell line, U-2 OS, acquired from live-cell imaging. NK cells were added at time 0 (time is indicated in unit of hours at the upper corner of the still images). Cell death was scored by cell lysis. (B) Cumulative survival curves of target U-2 OS cells at the indicated co-culture condition: control (no NK cell, denoted in gray square); with NK92-MI at 2:1 NK-to-target ratio (black circle); with fresh primary NK cells at 2:1 (green circle) or 5:1 (green triangle) NK-to-target cell ratio; with 3-day IL-2 cultured primary NK cells at 2:1 (red circle) or 5:1 (red triangle) NK-to-target cell ratio. For all imaging experiments with primary NK cells, 50 ng/ml IL-2 was supplemented in the medium. Data were averaged from 3 independent imaging experiments and the number of cells analyzed ranges from 55 to 188, varied between conditions and experiments. Individual target U-2 OS cells were monitored by time-lapse microscopy, and the time from NK cell addition to morphological target cell death was analyzed and plotted as cumulative survival curves. (C) Fluorescent images of the granzyme-B FRET reporter from U-2 OS cells alone (1st column), U-2 OS in co-culture with NK92-MI for 10 hrs (2nd column) and U-2 OS in co-culture with 3-day IL-2 cultured primary NK cells for 10 hrs (3rd column). The images are overlay of the CFP (denoted by blue) and YFP (denoted by green) channels. (D) Distribution of the granzyme-B dependent (solid gray column) and independent (open column) killing of U-2 OS cells by different NK cells at the indicated co-culture conditions. The NK-to-target cell ratio is indicated at the top of the respective data set. Error bars: Standard deviations from 3 independent imaging experiments.

