
Figure 2. Expression of CRT and HMGB1 by PDT.
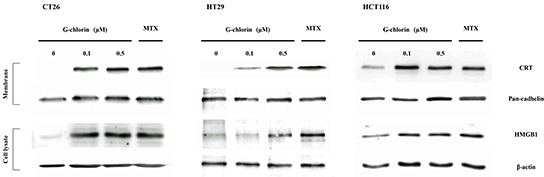
CT26, HT29, or HCT116 cells were loaded with G-chlorin for 4 hours and then irradiated with 16 J/cm2 of 660-nm LED light. CT26, HT29, and HCT116 cells were incubated with 1 μM mitoxantrone (MTX) as a positive control. CRT or HMGB1 protein expression was measured by western blotting at 4 hours after treatment.