
Figure 3. Translocation of CRT and HMGB1 by PDT.
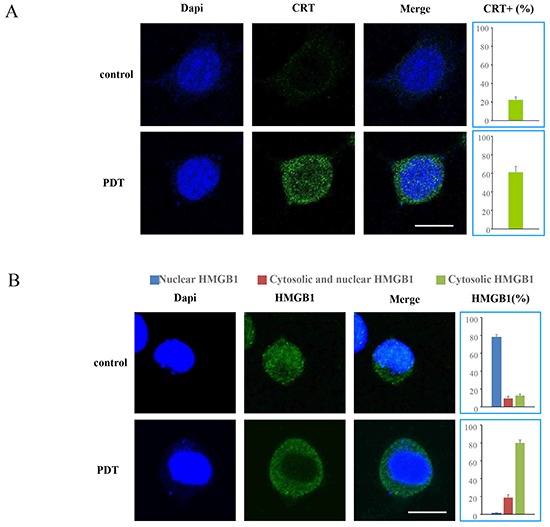
CT26 cells were loaded with G-chlorin for 4 hours and irradiated with 16 J/cm2 of 660-nm LED light. Translocation of CRT and HMGB1 was assessed by immunofluorescence staining at 4 hours after treatment with PDT with G-chlorin. Images were obtained using confocal microscopy (original magnification ×1000; scale bar = 10 μm). Data are means of three independent experiments ± SD. (A. CRT, B. HMGB1)