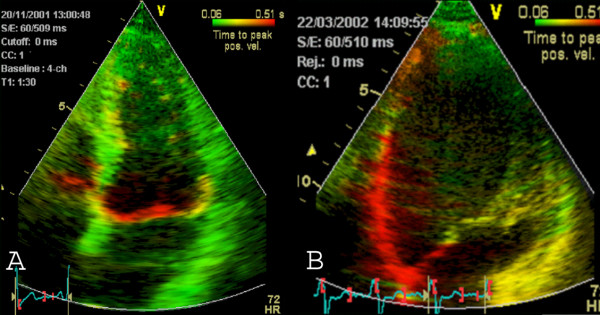
Figure 6.
Tissue Synchronization Imaging displays colour-coded time-to-peak tissue Doppler velocities. The colour-coding is green (normal time-to-peak velocity: 20–150 ms), yellow (150–300 ms) and red (300–500 ms) Apical four chamber view. A) TSI in a control patient (only green colour coding indicating synchronous contraction) B) TSI in a patient with LBBB: The basal and mid-septal segments show a delayed time-to-peak velocity (red colour).

