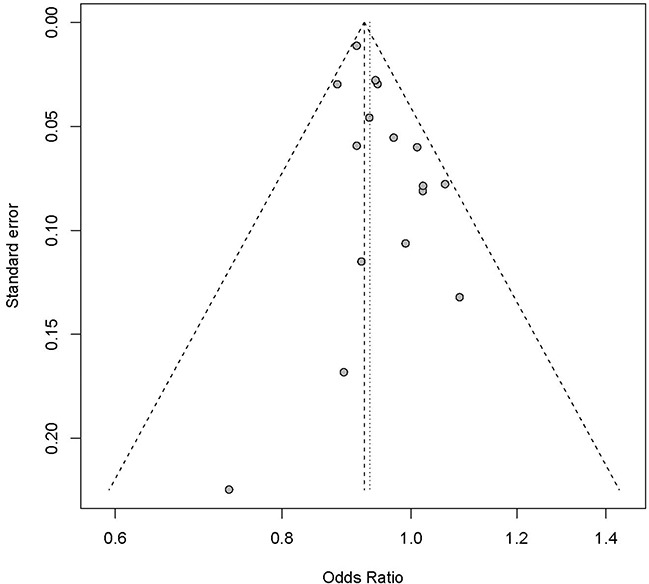
Figure 3. Funnel plot for publication bias analysis of the selected studies investigating the association between rs9929218 polymorphism and CRC.

The X-axis stands for the ORs and the Y-axis is the standard error for each of the 16 studies. A linear regression based approach proposed by Egger et al. is used to evaluate the asymmetry of the funnel plot.
