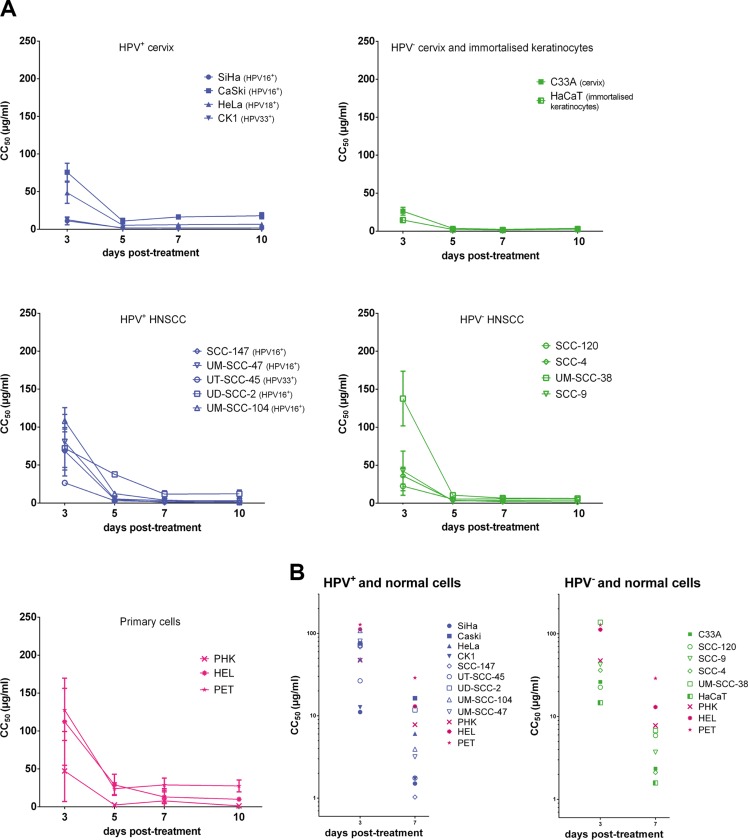
Figure 1. Antiproliferative effects of CDV.
CC50 values in function of days post treatment. Cells seeded in a 96 well plate were treated after 24 h with dilutions of CDV ranging from 0.05 μg/ml to 200 μg/ml. At 3, 5, 7 and 10 days post treatment, cells were counted with a Coulter counter to calculate CC50 values. The CC50 value is the concentration of CDV needed to inhibit cell growth by 50%. HPV+ cell lines are indicated in blue, HPV− in green and the normal cells in pink. Cervical cancer cell lines are indicated by closed symbols and HNSCC by open symbols. Values are shown as mean of minimum 3 experiments per cell line and SEM. (A) CC50 values in function of day 3, 5, 7 and 10 post-treatment. (B) CC50 values in function of day 3 and 7 post-treatment.

