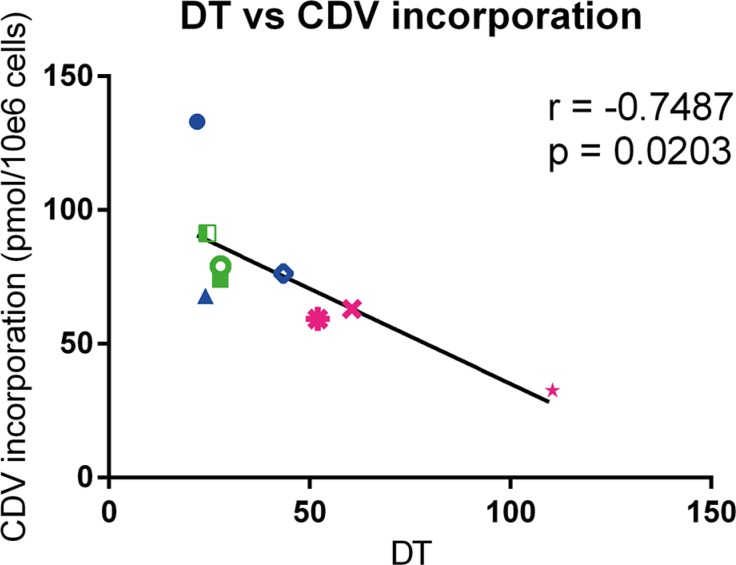
Figure 3. Correlation between doubling time and CDV incorporation at day 3 post infection.
Pearson correlation was calculated between DT and incorporation of CDV into genomic DNA of the cells. HPV+ cell lines are indicated in blue, HPV− in green and the normal cells in pink. Cervical cancer cell lines are indicated by closed symbols and HNSCC by open symbols.

