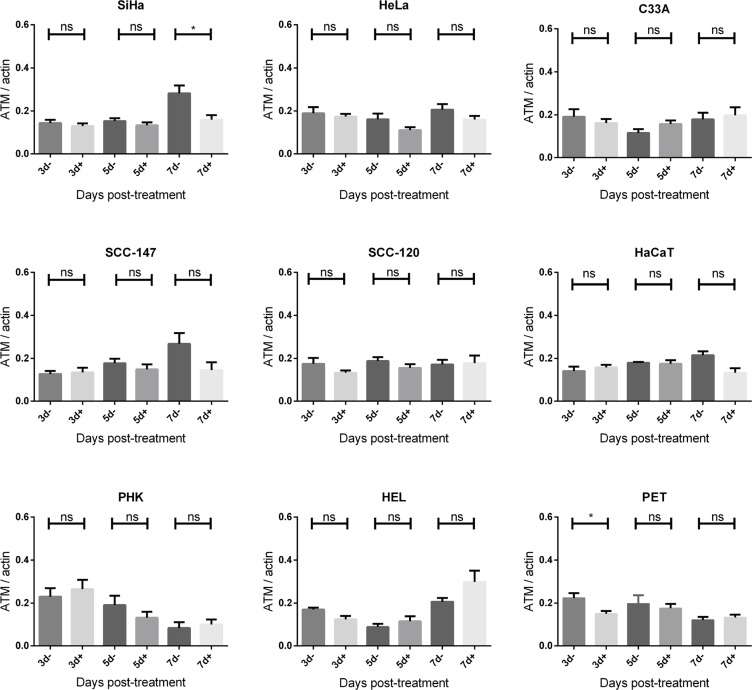
Figure 6. ATM protein expression after CDV exposure.
Protein extracts were obtained at 3, 5 and 7 days of no treatment or treatment with 50 μg/ml CDV. Afterwards, Western blotting was performed using anti-ATM antibody and anti-actin antibody as a loading control. The amount of ATM relative to actin is shown in arbitrary units (AU) for all the cell lines. For each blot, the sum of intensity values was calculated and used for normalization of the values per blot. Statistical significance was indicated as follows:p < 0.05 (*). Values are shown as mean of minimum 3 experiments and SEM.

