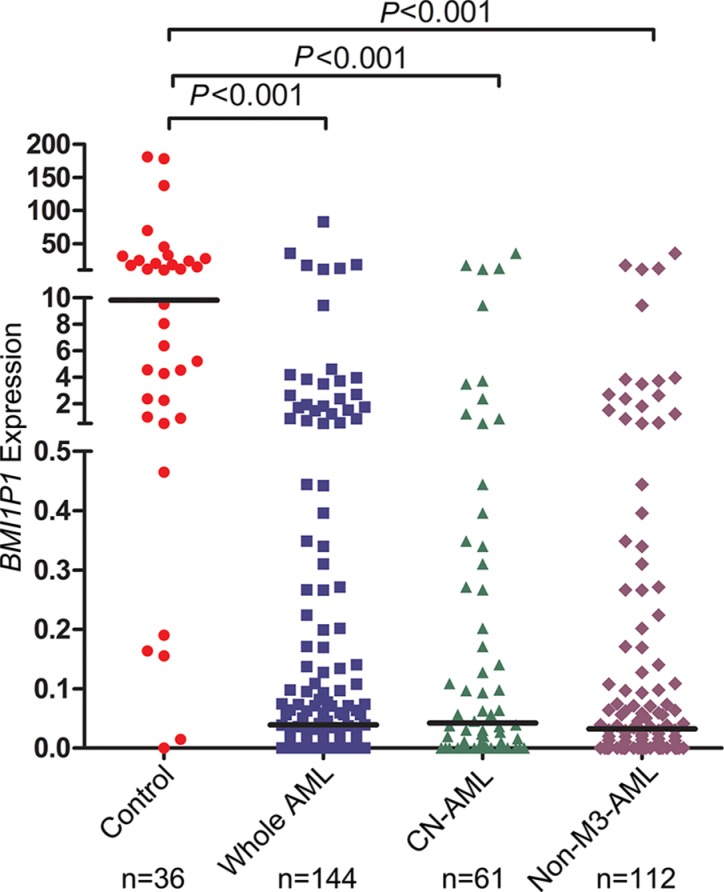
Figure 1. Relative expression levels of BMI1P1 in AML and controls.
Expression of BMI1P1 in BMNCs was measured via using RQ-PCR in healthy controls, whole AML, CN-AML and non-M3-AML samples. Horizontal lines represent the median, and each dot represents an individual sample. Statistical analysis was performed using Wilcoxon tests, and significance was defined as P < 0.05.

