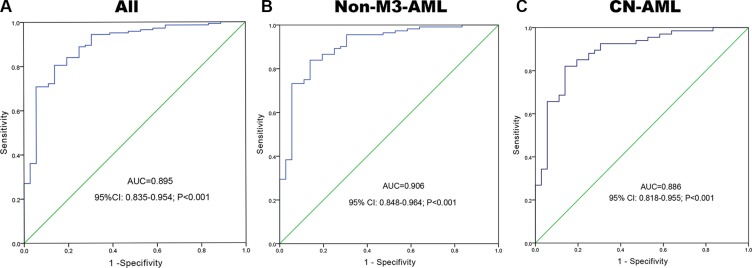
Figure 3. BMI1P1 expression offers a powerful diagnostic tool in identification of AML patients.
(A) All patients; (B) non-M3-AML; (C) CN-AML. ROC analysis showed that the area under the curve (AUC) of BMI1P1 was 0.895 (P < 0.001), 0.906 (P < 0.001) and 0,886 (P < 0.001) in whole AML, non-M3-AML and CN-AML, respectively.

