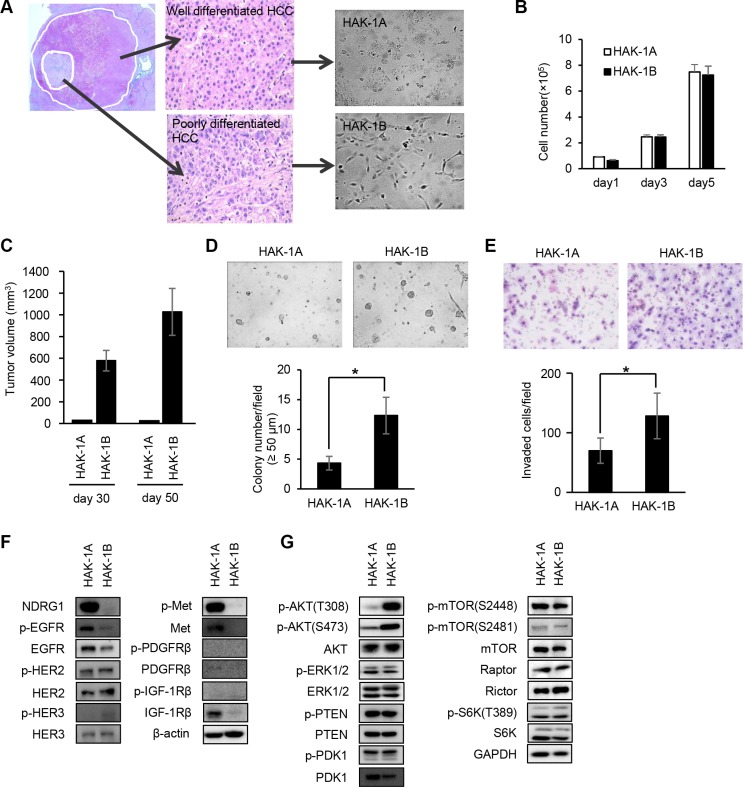
Figure 1. Comparison of the biological and biochemical characteristics of HAK-1A and HAK-1B cells.
(A) Morphology of HCC cell lines in culture. HAK-1A shows cobblestone-like morphology, and HAK-1B shows a fibroblastic morphology when cultured in plastic dishes. A single HCC tumor showing a nodule-in-nodule appearance. The well differentiated HAK-1A and poorly differentiated HAK-1B cell lines were derived from the outer and inner nodules of the same tumor, respectively. (B, C) Comparison of cell proliferation rates in vitro (B), and tumor growth rates on days 30 and 50 in nude mice (C) engrafted with HAK-1A and HAK-1B cells (n = 3). Each bar is the average ± standard deviation (SD). (D) Comparison of colony formation under “Matrigel on top” culture conditions between HAK-1A and HAK-1B cells. Representative images of colonies of HAK-1A and HAK-1B cells incubated for 5 days (upper panel). The number of colonies > 50 μm (lower panel) (n = 3). Each bar is the average ± standard deviation (SD), *P < 0.05 (two-tailed Student t test). (original magnification ×40) (E) Comparison of invasion of Matrigel between HAK-1A and HAK-1B cells. Representative images of invaded cells incubated for 24 hr (upper panel), and the number of invaded cells (lower panel) (n = 3). Each bar is an average ± SD, *P < 0.05 (two-tailed Student t test). (original magnification ×40) (F) Comparison of expression levels of NDRG1 and growth factor receptors in HAK-1A and HAK-1B. β-actin served as loading control. (G) Comparison of the expression of downstream effectors in HAK-1A and HAK-1B cells. GAPDH served as loading control.

