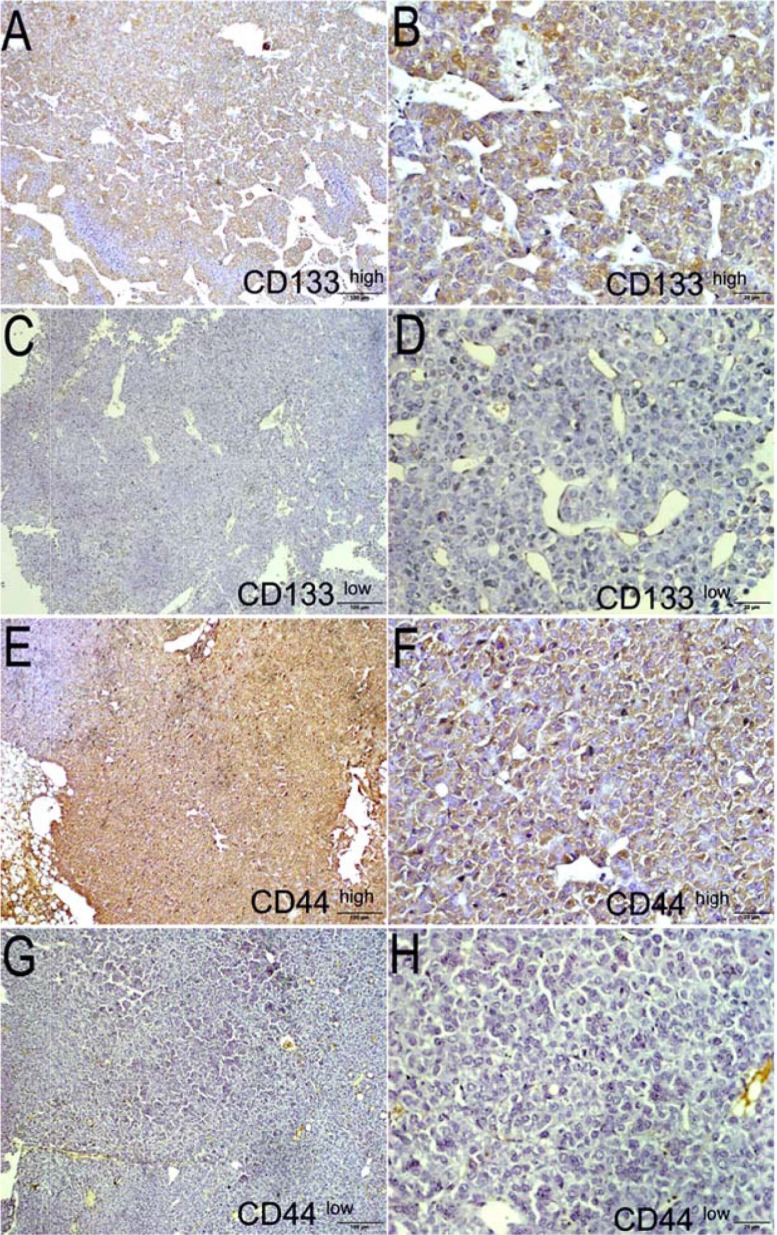
Figure 5. Expression of markers CD133 and CD44 in tumors using HE staining (left panel) and IHC (right panel) from PDX models.
Representative HE staining (A) and its expression of CD133 (B) from the CD133 high expression group vs HE staining (C) and its expression of CD133 (D) from the CD133 low expression group; Representative HE staining (E) and its expression of CD44 from the CD44 high expression group (F) vs HE staining (G) and its expression of CD44 (H) from the CD44 low expression group. Original magnification for all pictures is 400×.

