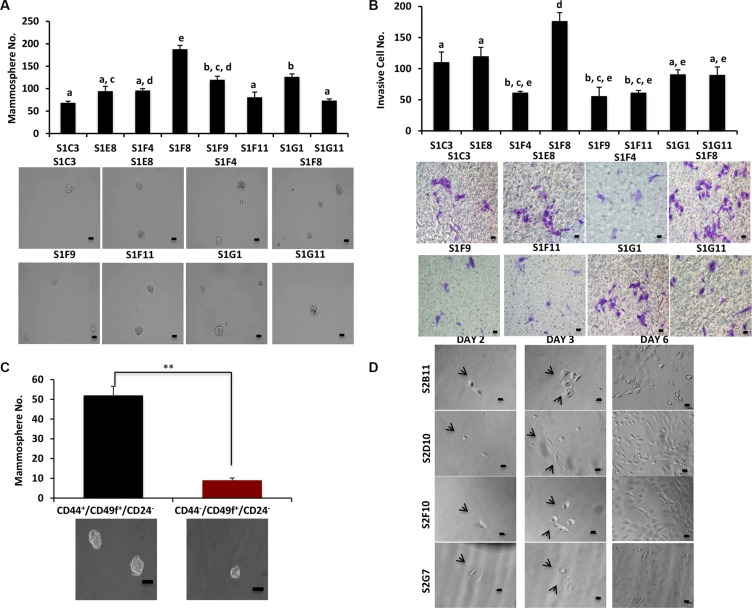
Figure 1. CD49f+/CD24− single-cell derived clones have different self-renewal and invasion capabilities.
(A), Mammosphere formation was evaluated in different clones that were derived from CD49f+/CD24− single cells. Clones showed a big variation in terms of their mammosphere forming capacity. Bar scale represents 50 μm. One-way ANOVA is used to perform the correlation analysis. Samples with no statistically significant differences are placed in the same letter group. Differentiated groups have at least a p value of less than 0.05. (F stat = 53.45; p value = 4.3e-06; df = 7). (B) The ability of the CD49f+/CD24− single cell derived clones to invade was assessed via transwell invasion assay. The clones showed a variation in terms of their invading capacity and the invasion pattern of the clones matched their mammosphere formation ability. Bar scale represents 25 μm. One-way ANOVA is used to perform the correlation analysis. Samples with no statistically significant differences are placed in the same letter group. Differentiated groups have at least a p value of less than 0.05. (F stat = 24.07; p value = 9.04e-05; df = 7). (C) MCF10DCIS parental cells were sorted into two groups CD49f+/CD44+/CD24− and CD49f+/CD44+/CD24− and used for mammosphere formation assay to understand the role of CD44 in self-renewal of DCIS cells. Bar scale represents 50 μm. Data represents the mean ±S.D (n = 3); **p < 0.01. (D) Representative images of single-cell sorting process from 4 clones that were used extensively in the future experiments. The images show the cells at day 1 as single cells or single cells getting ready to divide as well as the progress of the single cells to form the clones in different days. Bar scale represents 25 μm.

