
Figure 7. Aggressive CD49f+/CD44+/CD24− single-cell derived clones show tumorigenesis in vivo.
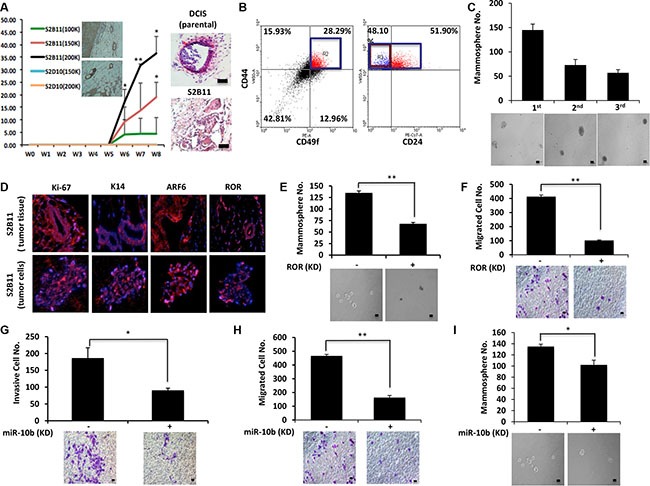
(A) Athymc nude mice were injected with 2 × 10⁵, 1.5 × 10⁵ and 1 × 10⁵ of S2B11 cells and 2 × 10⁵ and 1.5 × 10⁵ of S2D10 cells. All mice that were injected with S2B11 cells formed tumors and none of the mice that were injected with S2D10 cells showed any tumor formation. The high expression level of K14 was confirmed in S2B11 tumors via IHC. H&E staining showed the more invasive nature of the S2B11 tumors. Bar scale represents 100 μm. Data represents the mean ±S.D (n = 10); *p < 0.05, **p < 0.01. (B) CD49f+/CD44+/CD24− stem cell-like subpopulation in S2B11 tumors was confirmed via FACS analysis showing that this subpopulation was consisting 13.6% of whole tumor cell population. (C) Mammosphere formation ability of the primary S2B11 tumor cells was evaluated for 3 generations showing their ability to self-renew. Bar scale represents 50 μm. Data represents the mean ± S.D. (D) Immunofluorescence staining shows a significant Ki-67, K14, ARF6 and RoR expression in the spheres formed by S2B11 primary tumor cells and in the tumor tissue itself. (E, F) Mammosphere formation ability (Bar scale represents 50 μm) (E) and migration capacity (Bar scale represents 25 μm) (F) was evaluated in S2B11 primary tumor cells after knocking-down the RoR with shRoR. Data represents the mean ±S.D (n = 3); **p < 0.01. (G, H, I) Invasion capacity (Bar scale represents 25 μm) (G), migration capacity (Bar scale represents 25 μm) (H) and mammosphere formation ability (Bar scale represents 50 μm) (I) of S2B11 primary tumor cells was evaluated after knocking-down the miR-10b with sponge miR-10b. Data represents the mean ±S.D (n = 2); *p < 0.05, **p < 0.01