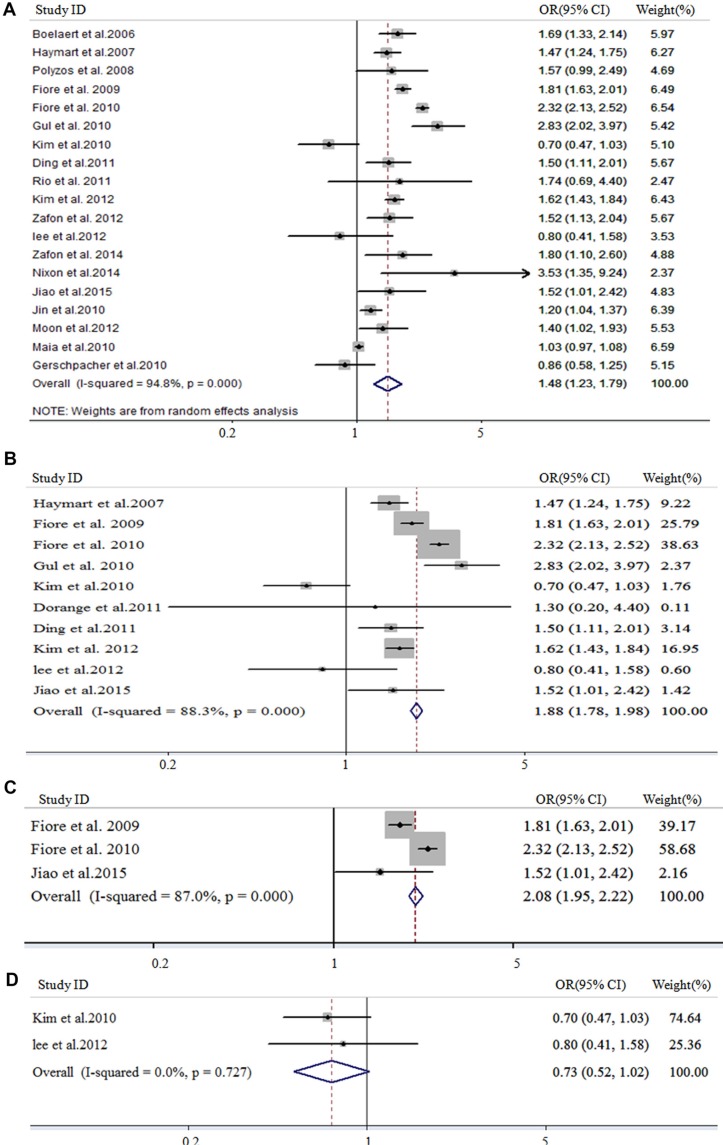
Figure 2. Forest plot for study-specific and pooled OR in overall meta-analysis.
The size of each grey square is proportional to the study's weight calculated as inverse of variance. OR, odd ratio; 95% CI, 95% confidence intervals; thyroid cancer, all the histological types of thyroid cancer (19 studies); DTC, differentiated thyroid carcinoma (10 studies); PTC, papillary thyroid carcinoma (3 studies); FTC, follicular thyroid carcinoma (2 studies). Weights are from random effects analysis.

