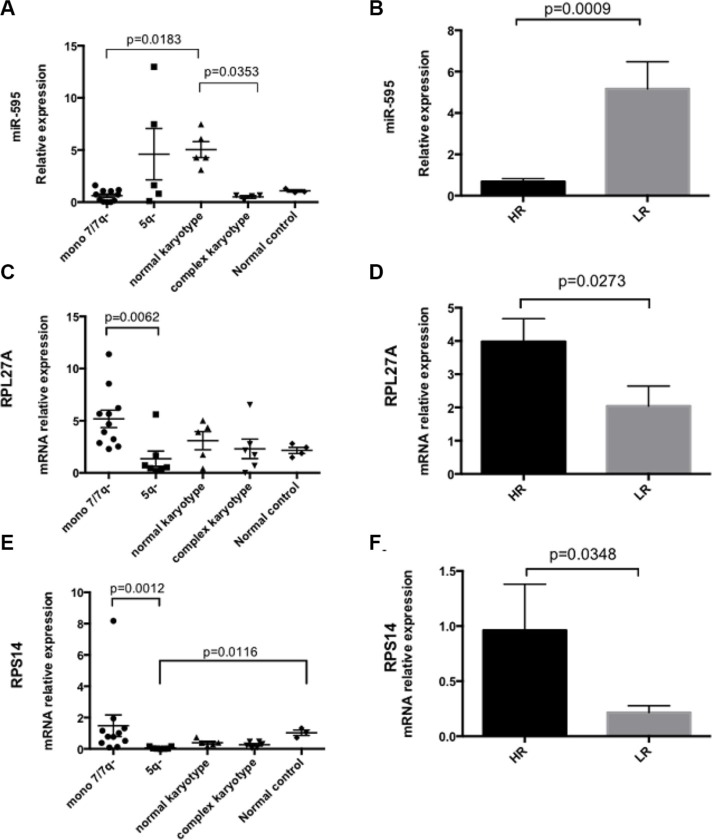
Figure 8. miR-595, RPL27A and RPS14 expression in MDS bone marrow CD34+ samples.
First, miR-595 expression was analysed in bone marrow CD34+ samples from 29 MDS patients (mir-595 was not detected in 2 patients). miR-595 expression was significantly downregulated in MDS with −7/7q- MDS (n = 11) compared with normal karyotype MDS (n = 5). Significant differential expression of miR-595 was also evident between CD34+ cells derived from MDS patients with complex karyotype containing chromosome 7 anomalies compared to those from MDS patients with a normal karyotype (A). miR-595 was significantly upregulated in LR MDS compared with HR MDS (B). Relative expression was calculated using the ΔΔCT method and RNU6B was used to normalize all samples. Bars represent mean ± SEM. Next, RPL27A, RPS14 and RPL5 expression was determined in BM CD34+ samples from the same 29 patient cohort (C–F); Four control CD34+ samples were available. RPL27A was significantly upregulated in patients with −7/7q- compared with 5q- patients. Re-analysis according to IPSS score (HR = 17 and LR = 12) demonstrated that RPL27A and RPS14 were significantly upregulated in HR MDS compared with LR MDS in this cohort. Bars represent mean ± SEM.

