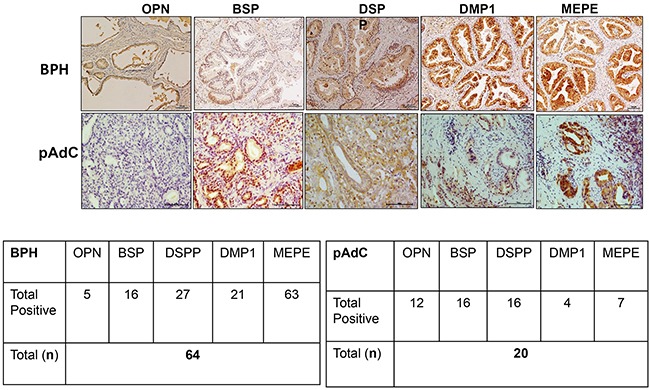
Figure 2. IHC on BPH and pAdC tissue sections showing positive immunoreactivity for the SIBLINGs.

Top row panel is representative IHC results (brown stain) for SIBLINGs expression in BPH. Second row represents illustrative positive immunoreactivity (bright red/brown stains) for SIBLINGs in pAdC. Experimental and tissue negative controls are as described in Figure 1. Scale bar, 100μm. Inserted tables summarize the number positive cases of BPH and pAdC for each of the SIBLING.
