
Figure 1. Expression of NRF2 and its target genes in glioma cell lines.
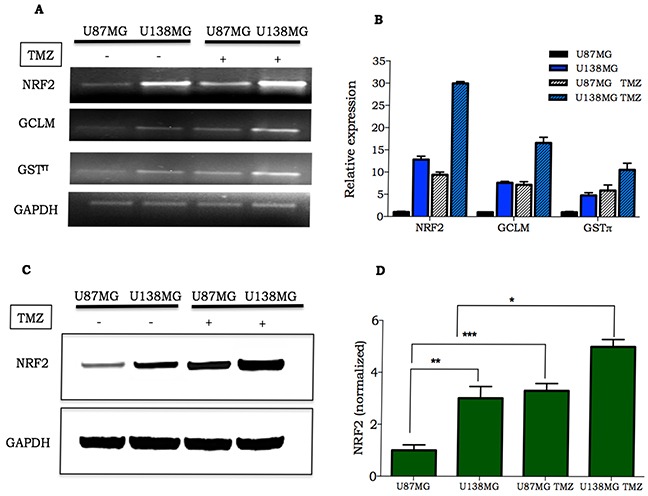
A-B. Representative image and quantification of NFR2, GCLM and GSTπ mRNA in U138MG and U87MG at basal level or 4 h after TMZ treatment (300 μM); C. NRF2 detection in glioma cells untreated or treated with 300 μM TMZ. Samples were collected 24 h after TMZ treatment and analyzed by western blot; D. Quantification of NRF2 protein expression in U87MG and U138MG submitted or not to TMZ treatment. Data were normalized by GAPDH expression followed by normalization by NRF2/GAPDH ratio verified on untreated U87MG cell line. Values are mean ± SEM of three independent experiments, *P< 0.05, **P< 0.01, ***P< 0.001.