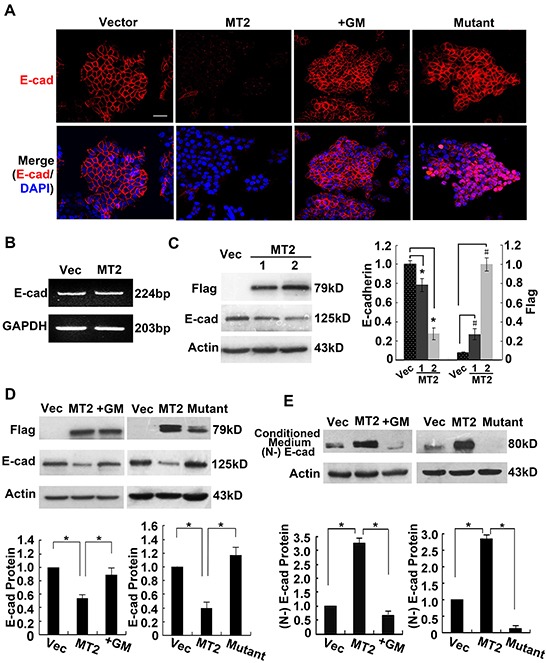
Figure 2. MT2-MMP results in the cleavage and loss of E-cadherin from adherens junctions.

A. Immunofluorescence analysis of E-cadherin protein expression using rabbit anti-E-cadherin antibody (1:50) and Alexa Fluor 594-labeled secondary antibody (1:1000), images captured by confocal laser microscopy (Alexa fluor 594, red; nuclei, DAPI staining, blue). Scale bar, 50 μm. B. RT-PCR analysis of E-cadherin mRNA levels in MT2-MMP transfectants versus vector transfectants, showing no changes between them. C. Western blot analysis of E-cadherin protein expression in MT2-MMP transfectants (1, without selection by flow cytometry; 2, selection by flow cytometry) or vector control transfectants, using a primary antibody rabbit anti-E-cadherin (1:1000) followed by HRP-conjugated secondary antibody. D. Western blot analysis of E-cadherin levels in vector cells, MT2-MMP cells, inactive mutant E260A cells, and GM6001 (25 μM) treated MT2-MMP cells. E. Immunoprecipitation and Western blot analyses of the ectodomain of E-cadherin in the conditioned medium of indicated transfectants. Goat anti-E-cadherin antibody (N-20, combination with N-terminal extracellular domain of E-cadherin; Santa Cruz) was used in both immunoprecipitation and Western blot assays. Mean ± SEM, n = 3. * and # represent P < 0.05.
